
- Markets
Find out what influences market movements by browsing through our tailor made product pages.
- Trading Platforms
Maximise your investment opportunities

Trading Platforms
In order to ensure our customers have the best trading experience. We are proud to introduce our suite of trading platforms.
- Accounts
All accounts can be opened using one application form.

OPEN A LIVE ACCOUNT
The application process is simple and straightforward. You can complete the online application form and be trading in minutes.
- Academy
Here you will find all the details regarding One Financial Markets educational offering

TRADING ACADEMY
Working through each of our six online modules, detailed below, you can develop your trading confidence
- Newsroom
The latest news in the Financial Markets from across the globe.

LATEST NEWS
Make sure you don't miss out on what's going on in the world around you, keep up to date with our market commentary and daily market update videos.
- Contact Us

American dollar falls to fresh yearly lows
4th May 2016
EUR/USD
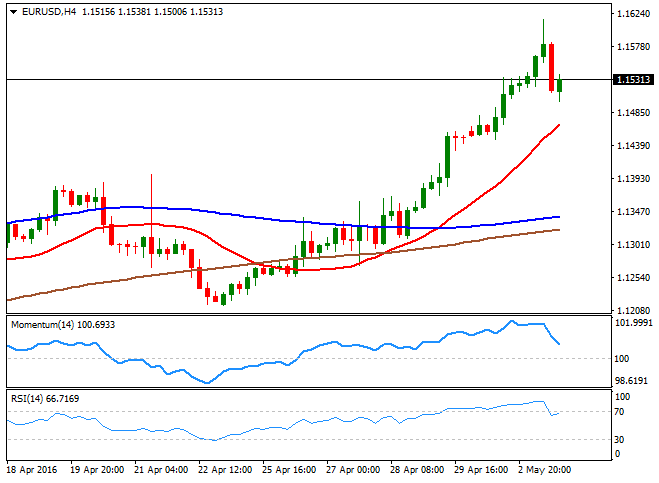
The American dollar fell to fresh yearly lows against most of its major rivals this Tuesday, as poor manufacturing data coming from China revived concerns over a global economic slowdown. European stocks plummeted, closing the day in the red, helping the common currency in surging to a fresh 8-month high of 1.1615 against the dollar. The release of better-than-expected data in Europe fueled demand for the common currency, as in March, industrial producer prices rose by 0.3% in the euro area, following a 0.7% in the previous month. The pair began to ease after the release of poor UK data, which gave the greenback a breath that turned into a strong intraday advance following Wall Street's opening.
The EUR/USD pair fell as low as 1.1500 before finally bouncing, to close the day flat. Nevertheless, the downward knee-jerk seems to have been merely corrective as in the 4 hours chart, the price remains far above a bullish 20 SMA, currently in the 1.1460 region, whilst the RSI indicator is resuming its advance after erasing extreme overbought conditions. Furthermore, and given the recent break above a major resistance, now support at 1.1460, the pair needs now to break below the 1.1380/1.1420 region to negate the ongoing bullish trend. The immediate resistance comes at 1.1565, and an upward extension beyond it should favor a retest of the mentioned high, en route to 1.1713, August 2015 monthly high.
Support levels: 1.1500 1.1460 1.1420
Resistance levels: 1.1565 1.1615 1.1660
USD/JPY
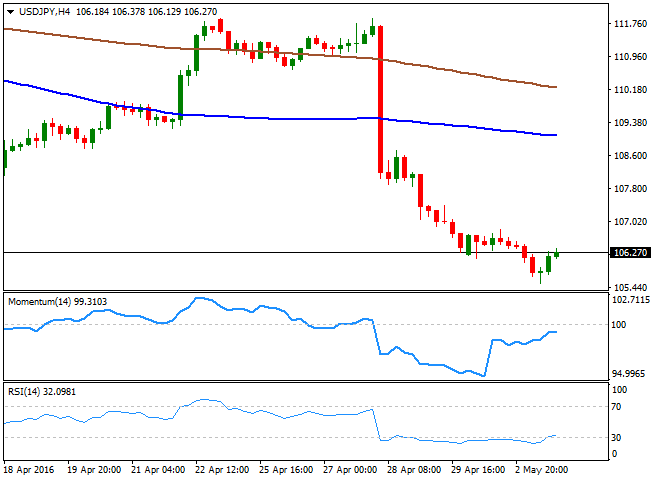
The USD/JPY pair extended its decline down to 105.54 before finally meeting some buying interest, and bounced modestly to close the day a handful of pips above the 106.00 mark. With Japanese markets closed for the Golden Week holidays, chances of a BOJ's intervention are limited, yet the risk of a surprise announced could not be dismissed. In the meantime, market players seem determinate to test BOJ's convictions by pushing the pair towards the 105.00 line in the sand, established a couple of weeks ago, something that should be favored by the continued negative mood. Intraday technical readings maintain the risk towards the downside, given that in the 1 hour chart, the price continues developing well below its 100 and 200 SMAs, with the shortest accelerating its decline and now around 107.50, whilst the technical indicators have corrected extreme oversold readings to end up turning flat within neutral territory, suggesting limited buying interest at current levels. In the 4 hours chart, technical indicators have also lost their upward strength after correcting from oversold territory, but remain well below their mid-lines, in line with a new leg south, particularly if the 106.00 level gives up again.
Support levels: 106.00 105.55 105.20
Resistance levels: 106.60 107.00 107.40
GBP/USD
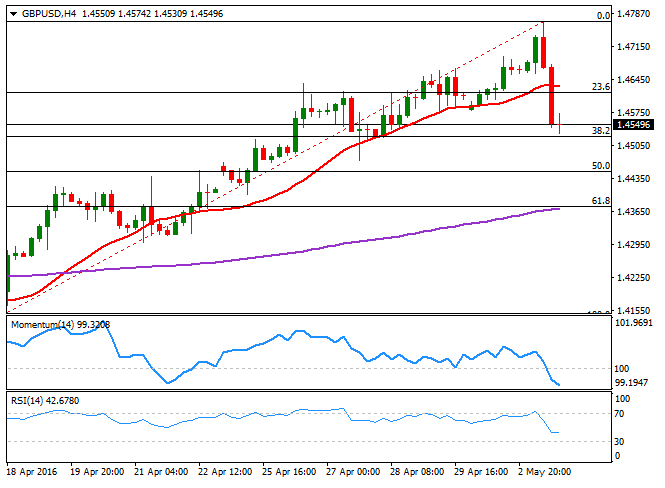
Following an advance to 1.4769, a fresh 4-month high, the GBP/USD pair plunged to 1.4530, with the Pound initially hit by the final revision of the UK April Markit manufacturing PMI that fell below 50.00 for the first time since March 2013, coming in at 49.2. The decline in the pair was later fueled by a sharp comeback of the greenback during the US afternoon, and the pair remains unable to pick up ahead of the Asian opening, trading near the mentioned low at the end of the day. The daily decline stalled a couple of pips above a major support, the 38.2% retracement of the latest bullish run, triggered by easing fears over a Brexit, at 1.4525, now the main support. From a technical point of view, the 4 hours chart supports some further declines as the divergence drew by the Momentum indicator, which started mid last month, got confirmed when the indicator broke below its mid-line. In the same chart, the RSI indicator consolidates at 42, rather reflecting the scarce volume typical of this time of the day than suggesting downward exhaustion, whilst the 20 SMA has turned flat in the 1.4630 region. Renewed selling interest below the mentioned Fibonacci support can see the pair sliding down to the 1.4370 region, the 61.8% retracement of the same rally.
Support levels: 1.4525 1.4480 1.4440
Resistance levels: 1.4585 1.4630 1.4680
AUD/USD
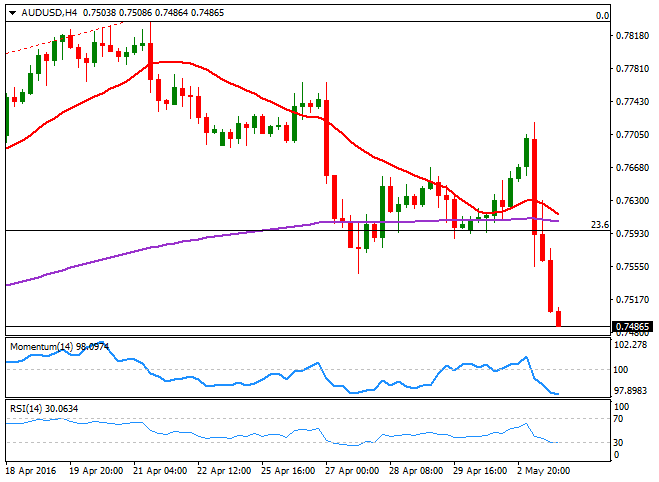
The Aussie is in a free fall ever since the Reserve Bank of Australia cut interest rates by 25bp to a record low of 1.75%, basing the decision on latest inflation readings, as Stevens remarked that "inflation has been quite low for some time and recent data were unexpectedly low,” pointing to a lower outlook for inflation than initially estimated. Also, the RBA's head reiterated his concerns over a strong Aussie that could "complicate" the economy’s transition away from mining investment. The AUD/USD pair traded as high as 0.7718 before plummeting below the 0.7500 mark by the end of the day, now around 0.7488, its lowest since late March. In the 4 hours chart, the price remained capped by a flat 20 SMA, now around 0.7660, while the technical indicators head sharply lower within bearish territory, with room to extend their slides. and supporting a downward continuation, particularly if the ongoing decline extends below 0.7450, the 38.2% retracement of this year's rally, a major support.
Support levels: 0.7450 0.7415 0.7370
Resistance levels: 0.7510 0.7560 0.7600
Dow Jones
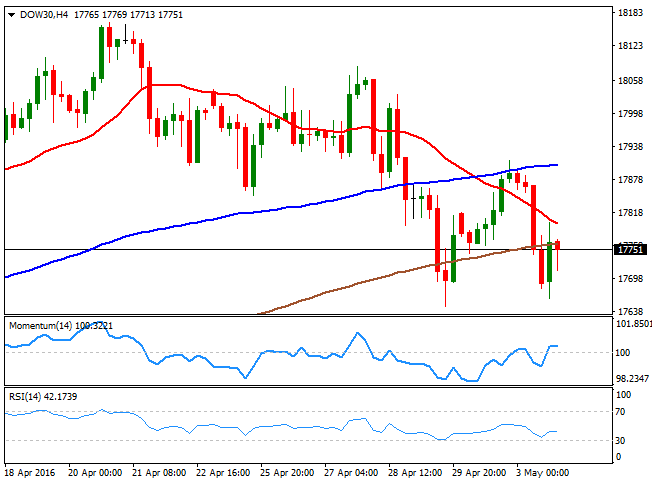
Wall Street plummeted as tech stocks remained under pressure, while oil's decline sent the energy sector 2.4% lower. The Dow Jones Industrial Average dived 140 points to close at 17,750.91, the Nasdaq lost 1.13% to end at 4,763.22, while the S&P ended at 2,063.37, down by 18 points. US stocks bounced from their lows but risk aversion prevailed, as soft manufacturing figures coming from China and the UK, spurred concerns over a global economic slowdown. The DJIA flirted with late April low of 17,646 before recovering, but a negative tone persists in the daily chart, as the benchmark remained below its 20 SMA, whilst the technical indicators head slightly lower right below their mid-lines. In the 4 hours chart, the 20 SMA has accelerated its decline above the current level and below the 100 SMA, with the shortest at 17,797, now the immediate resistance, whilst the Momentum indicator is flat around the 100 level, and the RSI turned lower around 42, increasing the risk of a downward extension, on a break below the mentioned 17,646 level.
Support levels: 17,713 17,646 17,574
Resistance levels: 17,799 17,861 17,912
FTSE 100
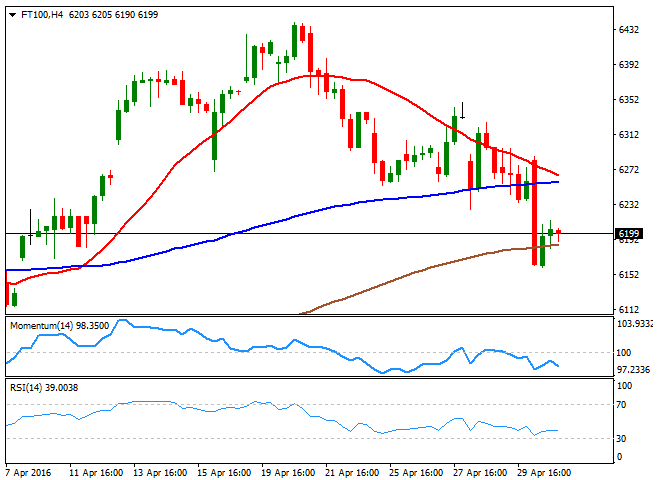
The FTSE 100 fell to a 3-week low, down 0.90% to close at 6,185.59, as poor manufacturing data coming from China weighed on the mining sector. Shares in Anglo American dived 12.8%, Glencore fell 8% and BHP Billiton dropped 6.2% on the news, whilst the index's negative tone was fueled by another batch of poor earnings reports all across Europe. Particularly in the UK, Aberdeen Asset Management dropped 7.4% after reporting a sharp fall in half-year profits, affected by the downturn in emerging markets. Holding near close ahead of the Asian opening, the daily chart for the index shows that its back below the 200 DMA, while the technical indicators present bearish slopes having broken below their mid-lines. In the shorter term, the 4 hours chart presents an even stronger bearish potential, given that the technical indicators head strongly lower near oversold levels, whilst the 20 SMA has accelerated its decline and is about to cross below the 100 SMA, both above the current level.
Support levels: 6,157 6,101 6,062
Resistance levels: 6,214 6,256 6,310
DAX
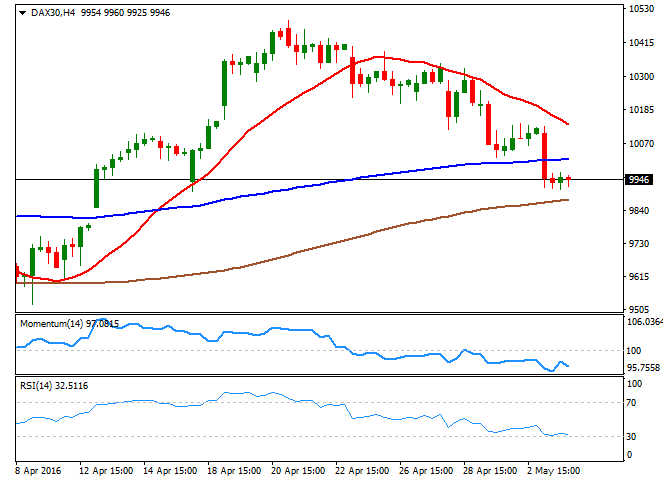
The German DAX fell 1.94% or 192 points to end the day at 9,926.77, following further declines in oil's prices and renewed concerns over a weakening global economy, after China's manufacturing sector contracted for a fourteenth month in-a-row. Also, weighing in European stocks' markets was a downgrade of EU's growth forecast coming from the European Commission, precisely as a consequence of Chinese slowdown. Leading the decline was Commerzbank, down 9.55% after reporting earnings more than halved in the first quarter of the year, while Deutsche Bank shed 6.27%. Auto-makers also suffered, as BMW also posted a decline in its first-quarter operating profit, ending the day down 3.81%. The index is back below the 10,000 mark, and if the market doesn't manage to regain it quickly, bulls will likely give up, resulting in a sharper downward movement. In the daily chart, the benchmark is now below its 20 DMA and a few points above the 100 DMA, the immediate support at 9,891, while the technical indicators maintain their bearish slopes after crossing below their mid-lines, in line with further declines. In the 4 hours chart, technical readings are also biased lower, as the indicators resumed their declines following a tepid upward correction within negative territory.
Support levels: 9,891 9,819 9,741
Resistance levels: 9,970 10,052 10,132
Nikkei
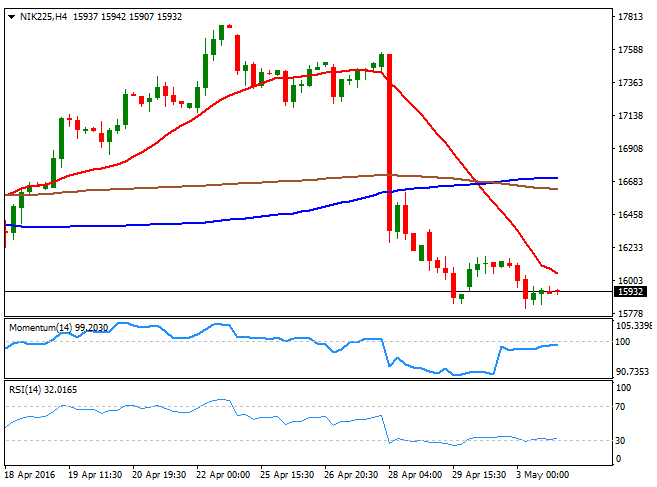
Asian shares closed mostly higher this Tuesday, fueled by RBA's decision to cut its main benchmark and despite Chinese Caixin Manufacturing PMI weakened to 49.4 in May from 49.7 in April, below market expectations. Japanese markets were closed in observance of the Constitution Day, the first day of three in this Golden Week. In futures trading, however, the benchmark closed the day in the red around 15,937 and the daily chart shows that the technical indicators are biased lower within bearish territory, whilst the index remains well below its moving averages, supporting some further, but tepid declines. In the 4 hours chart, the 20 SMA approached current levels and currently stands at 16,057, while the RSI indicator continues consolidating in oversold territory, and the Momentum indicator turned flat right below the 100 level, all of which maintains the risk towards the downside.
Support levels: 15,907 15,812 15,755
Resistance levels: 15,968 16,057 16,115
Gold
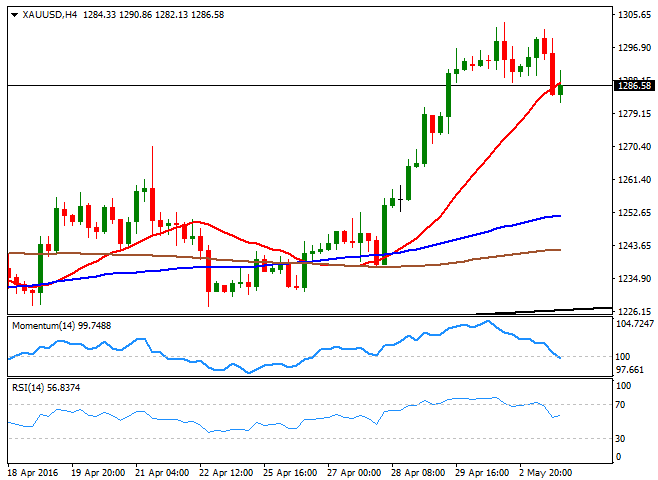
Gold prices surged at the beginning of the day, but the u-turn in the greenback during the American afternoon, sent the commodity into the red, with spot down to a fresh weekly low of $1,282.13 a troy ounce before settling around 1,286.50. The intraday decline was also blamed on dull psychical demand from China and India, with overall physical buying down 23.8% during the three months to March and compared to Q1 2015, falling to 781 tons from 1,025 tons last year. Spot's daily chart shows that the bright metal remains at its highest since late January and well above a bullish 20 SMA, while the technical indicators have lost upward strength and turned south, holding however, near overbought territory. In the 4 hours chart, the commodity is currently trading below a bullish 20 SMA, whilst the technical indicators have turned flat around their mid-lines, following a retracement from overbought territory, suggesting the latest decline has been corrective. A break below 1,283.50, however, should lead to a bearish continuation this Wednesday that can extend down to the 1,261/64.00 region.
Support levels: 1,283.50 1,271.10 1,262.30
Resistance levels: 1,290.85 1,297.10 1,308.40
WTI Crude Oil
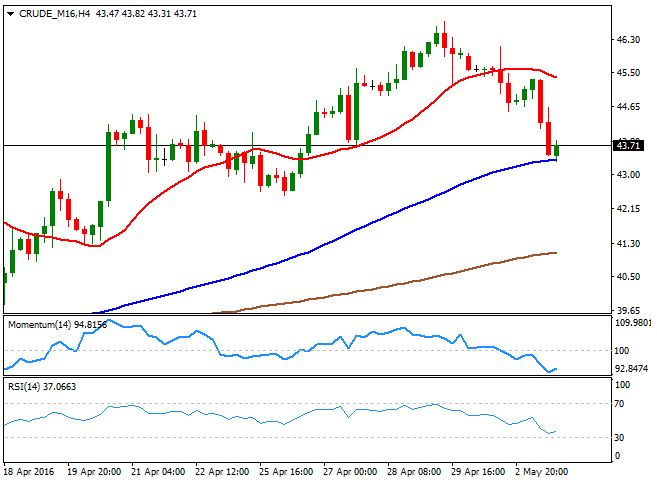
Crude oil prices extended their declines this Tuesday, as following news of an OPEC output increase, China reported that demand stagnated in April, re-triggering concerns over a worldwide glut. Light, sweet crude for June delivery fell to $43.35 a barrel on the New York Mercantile Exchange while Brent, fell 76 cents, or 1.6%, to $45.07 a barrel. WTI rose briefly above $46.00 last week on hopes US falling production will signal an end of the excess of supply, but speculative interest has quickly booked profits after the latest disappointing headlines. Now trading near the mentioned low, the daily chart shows that the intraday decline stalled around a now flat 20 SMA, while the RSI indicator turned sharply lower, but remains above its 50 level, suggesting additional declines are required to confirm a steeper slide. In the 4 hours chart, the technical indicators bounced modestly from near oversold territory before resuming their declines, whilst the 20 SMA now heads lower above the current level, in line with the longer term outlook.
Support levels: 43.20 42.50 41.80
Resistance levels: 44.10 44.90 45.60
CFDs are complex instruments and come with a high risk of losing money rapidly due to leverage. 75% of retail investor accounts lose money when trading CFDs with this provider. You should consider whether you understand how CFDs work and whether you can afford to take the high risk of losing your money.
CFDs are complex instruments and come with a high risk of losing money rapidly due to leverage. 76.3% of retail investor accounts lose money when trading CFDs with this provider. You should consider whether you understand how CFDs work and whether you can afford to take the high risk of losing your money.


