- Markets
Find out what influences market movements by browsing through our tailor made product pages.
- Trading Platforms
Maximise your investment opportunities

Trading Platforms
In order to ensure our customers have the best trading experience. We are proud to introduce our suite of trading platforms.
- Accounts
All accounts can be opened using one application form.

OPEN A LIVE ACCOUNT
The application process is simple and straightforward. You can complete the online application form and be trading in minutes.
- Academy
Here you will find all the details regarding One Financial Markets educational offering

TRADING ACADEMY
Working through each of our six online modules, detailed below, you can develop your trading confidence
- Newsroom
The latest news in the Financial Markets from across the globe.

LATEST NEWS
Make sure you don't miss out on what's going on in the world around you, keep up to date with our market commentary and daily market update videos.
- Contact Us
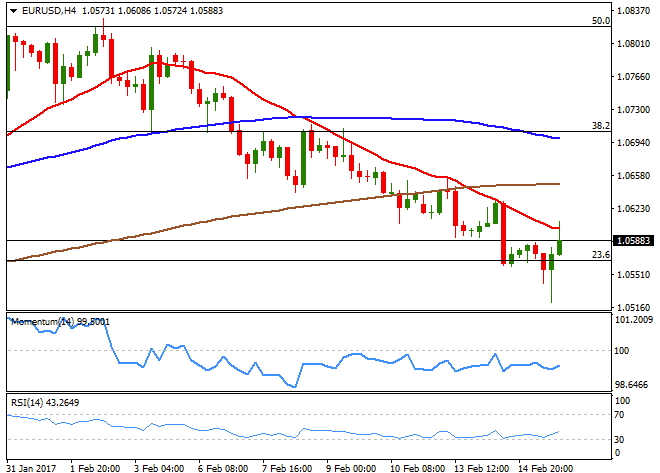
The EUR/USD pair closed the day marginally higher, right below the 1.0590 level
16th February 2017