
- Markets
Find out what influences market movements by browsing through our tailor made product pages.
- Trading Platforms
Maximise your investment opportunities

Trading Platforms
In order to ensure our customers have the best trading experience. We are proud to introduce our suite of trading platforms.
- Accounts
All accounts can be opened using one application form.

OPEN A LIVE ACCOUNT
The application process is simple and straightforward. You can complete the online application form and be trading in minutes.
- Academy
Here you will find all the details regarding One Financial Markets educational offering

TRADING ACADEMY
Working through each of our six online modules, detailed below, you can develop your trading confidence
- Newsroom
The latest news in the Financial Markets from across the globe.

LATEST NEWS
Make sure you don't miss out on what's going on in the world around you, keep up to date with our market commentary and daily market update videos.
- Contact Us

EUR/USD spent most of the first two sessions of the day consolidating its latest losse
26th May 2016
EUR/USD
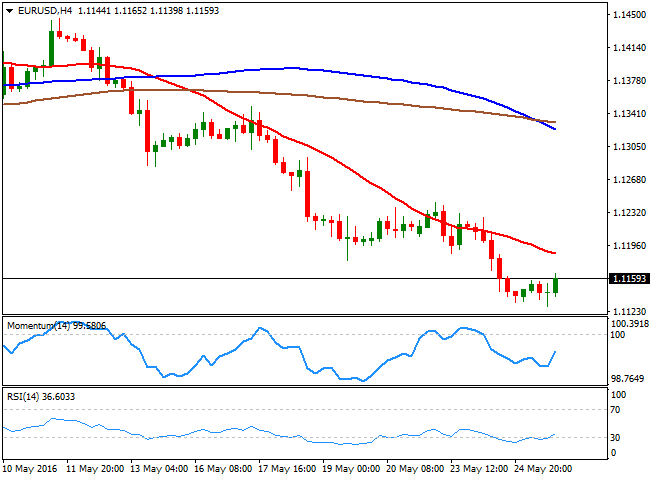
The EUR/USD pair spent most of the first two sessions of the day consolidating its latest losses, having extended its decline down to a fresh 2-month low of 1.1128 after the US opening. The pair, however, bounced mid US session, as a disappointing US Flash Services PMI pared dollar's gains. In the data front, Germany released its IFO confidence survey which came in much better-than-expected, as in May, business confidence increased to 107.7 from a previously revised 106.7, whilst expectations also rose up to 106.6 from previous 100.5. The GFK Consumer confidence for June, resulted at 9.8, beating expectations of 9.7. In the US, trade deficit widened less-than-expected, up to $57.5 billion last month from a final reading of $57.1 billion in March, and against the $-60.1 billion expected. The greenback held on to gains after the release of this last, but the Flash Markit services PMI weighed on the American currency, down to 51.2 in May from an upwardly revised 52.8 in the previous month. The EUR/USD pair recovered from a fresh 2-month low of 1.1128, but the upward potential remains well-limited, as in the 4 hours chart the technical indicators are barely correcting oversold readings, whilst the 20 SMA keeps heading lower above the current level, now around 1.1285. In the same chart, the 100 SMA has crossed below the 200 SMA in the 1.1320/40 region, reflecting the strength of the bearish move. A major static support comes at 1.1120, and a break below it should signal a steady bearish continuation towards 1.1040. Support levels: 1.1120 1.1080 1.1040
Resistance levels: 1.1200 1.1245 1.1280
USD/JPY
The USD/JPY pair rallied up to 110.44 this Wednesday, but pared gains as the dollar lost its charm on the back of poor US services PMI readings for the month of May. The sharp advance in worldwide stocks, however, has once again weighed on safe-haven assets. Having retreated some 30 pips from the mentioned daily high, the pair short term picture shows an increasing downward potential, as in the 1 hour chart, the technical indicators head south, but hold within positive territory, whilst the 100 SMA stands horizontal around 109.90, providing an immediate support. In the 4 hours chart, the technical indicators have also lost upward strength above their mid-lines, with the RSI accelerating its decline. In this last time frame, the 100 SMA advanced below the 200 SMA, with both converging in the 108.80/90 region. A break below this last then, should be the kick start to a downward continuation, down to 108.70. Support levels: 109.90 109.50 109.20 Resistance levels: 110.60 111.00 111.45

GBP/USD
Pound's impressive recovery has resulted in the GBP/USD pair regaining the 1.4700 figure and extending up to a fresh 3-week high of 1.4728 this Wednesday. Political uncertainty subsides in the UK as the latest Brexit opinion polls pointed out that the "remain" vote is further extending its lead. The macroeconomic calendar has been quite scarce in the kingdom this week, but this Thursday, it will release the second estimate of the Q1 GDP, initially estimated at 0.4%. In general, market is expecting a soft reading, in line with the macroeconomic figures released lately, which means that a reading of 0.4% or higher can support further Pound advances. Ahead of the Asian opening, the pair settled above the 1.4700, with a short-lived retracement in the US afternoon having met buying interest around 1.4685. In the 4 hours chart, the upward momentum is still strong, although the RSI indicator has turned flat around 70. Nevertheless, and with the pair having broken above the daily descendant trend line coming from early May high, the pair seems ready to extend its gains up to 1.4770 initially, with scope to extend up to 1.4920 should the mentioned resistance give up. Support levels: 1.4685 1.4640 1.4600 Resistance levels: 1.4730 1.4770 1.4815
AUD/USD
Commodity-related currencies recovered modestly at the beginning of the day, supported by a strong rally in Asian share markets that extended into early London. The AUD/USD pair advanced up to 0.7218, but was unable to hold on to gains beyond 0.7210, the 61.8% retracement of this year's rally. Data from Australia released at the beginning of the day showed that skilled vacancies picked up +0.6% in April, with a small pickup in the annual rate being a positive lead for employment. Construction Work Done however, came in weak for the Q1 at -2.6%. Overall, the downward trend remains firm, and although an upward corrective movement can't be disregarded, given the sharp decline seen in the last month. For the upcoming hours, the 1 hour chart suggests that the pair can extend its recover beyond the mentioned daily high, as the price is currently moving above a mild bullish 20 SMA, whilst the technical indicators have turned higher around their mid-lines. In the 4 hours chart, the downward strength has eased, but there are no technical signs that the pair can recover from current levels, given that the 20 SMA keeps capping the upside, whilst the technical indicators have turned modestly higher, but remain within bearish territory. Support levels: 0.7145 0.7100 0.7060 Resistance levels: 0.7215 0.7250 0.7290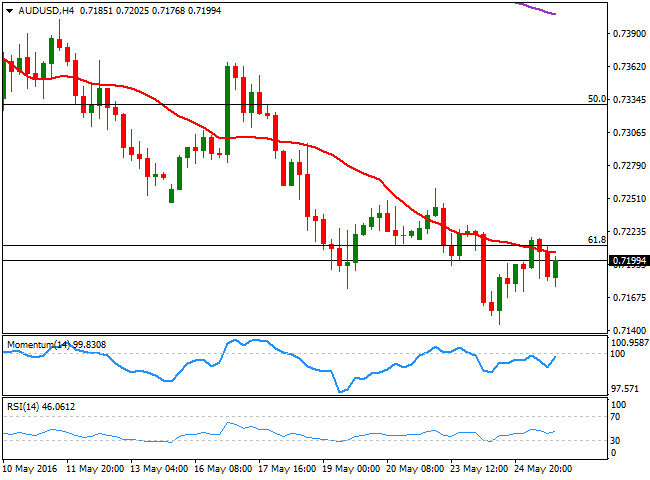
Dow Jones
US stocks rallied on the back of oil's strength, with the DJIA adding 145 points to close at 17,851.51. The Nasdaq advanced 33 points to end at 4,894.89, while the S&P added 0.70% to 2,090.54. Risk appetite dominated markets ever since the day started, accelerating in European trading hours as oil prices surged to fresh yearly highs. Among the worst performers was Alibaba, which plummeted 7% after disclosing that the US Securities and Exchange Commission is investigating its accounting practices. Technical readings in the daily chart support additional gains ahead, as the technical indicators have crossed their mid-lines towards the upside and maintain their bullish slopes, whilst the 100 DMA is crossing above the 200 DMA in the 17,200 region, indicating strong buying interest. In the shorter term, the 4 hours chart shows that the technical indicators are beginning to look exhausted towards the upside in overbought territory, but also that the index is firmly above its moving averages, limiting chances of a strong downward corrective move. Support levels: 17,825 17,770 17,702 Resistance levels: 17,915 18,004 18,082
FTSE 100
The Footsie advanced 0.70% or 43 points to end the day at 6,262.85, on growing support for the British campaign to remain in the European Union. Risk appetite and rising oil prices underpinned the London benchmark, which stands at its highest for the month. The energy-related sector led the advance, with gains of over 2% in most oil companies outpacing the 10% decline in M&S shares that plummeted after warning of a hit to its short-term profits. The index posted a higher high and a higher low daily basis, and whilst gains were modest, they were enough to support some further advances. In the same chart, the index is further above its moving averages that anyway remain horizontal, while the technical indicators present a limited upward strength within bullish territory. In the 4 hours chart, the Momentum indicator retreated from overbought levels, whilst the RSI indicator consolidates around 71 and the 20 SMA turned sharply higher below the current level, supporting a continued advance for this Thursday. Support levels: 6,245 6,183 6,139 Resistance levels: 6,279 6,326 6,373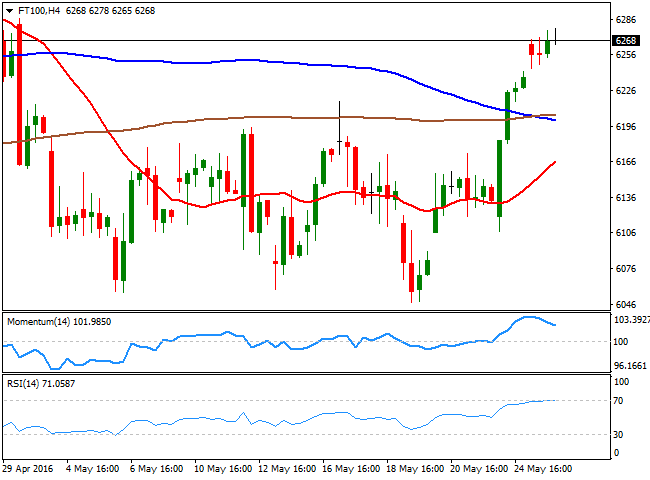
DAX
European equities surged for a second consecutive day, with the German DAX up by 150 points or 1.47% to close at 10,205.21, boosted by positive local data, and news that the EU finance ministers agreed on new loans for Greece. Among local shares, banks and auto-makers lead the way higher, with Commerzbank advancing 3.49% and Deutsche up by 3.44%, while BMW gained 2.38%. Trading at its highest since late April, the daily chart for the benchmark shows that it has advanced above its 200 DMA for the first time since Aril 28th, while the technical indicators maintain their bullish slopes well above their mid-lines, supporting some additional gains for this Thursday. In the shorter term, the 4 hours chart shows that the technical indicators are partially retreating from near overbought levels, but given that the index holds on to its gains and that the 20 SMA is turning higher far below the current level, the expected downward corrective movement will likely be limited. Support levels: 10,175 10,130 10,0079 Resistance levels: 10,200 10,286 10,348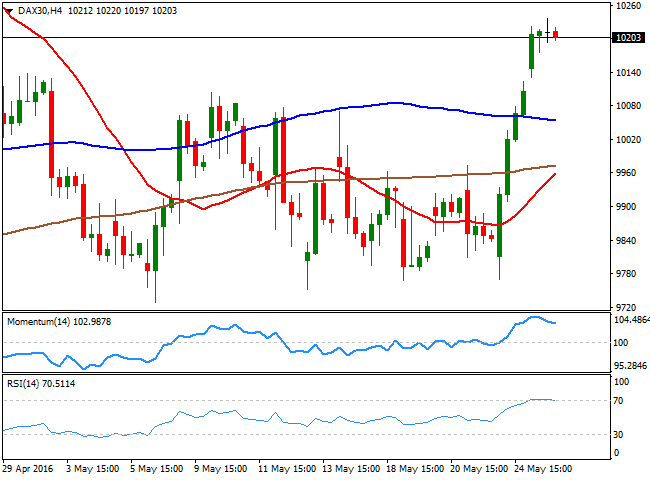
Nikkei
Asian shares surged, with the Nikkei rebounding on yen's weakness, and ending the day at 16,757.35 up by 1.57%. Sony Corp. surged 6.5%, leading the advance, in spite of reporting an annual profit outlook that fell short of analysts' estimates. The Japanese benchmark extended its rally up to 16,992 in after-hours trading, tracking Wall Street's gains, and is poised to start the new day around 16,950. Technically, the daily chart shows that the rally extended further above a bearish 100 DMA, whilst the RSI indicator heads north around 56, and the Momentum indicator consolidates well above its 100 line, all of which supports some further advances for this Thursday. In the 4 hours chart, the index is slowly detaching from the moving average congestion, while the technical indicators hold within positive territory, although with no certain directional strength. The index can recover up to the 17,200 region, April 26th intraday lows, should the positive mood extends into Asia and the benchmark regains the 17,000 figure. Support levels: 16,870 16,800 16,727 Resistance levels: 16,993 17,072 17,165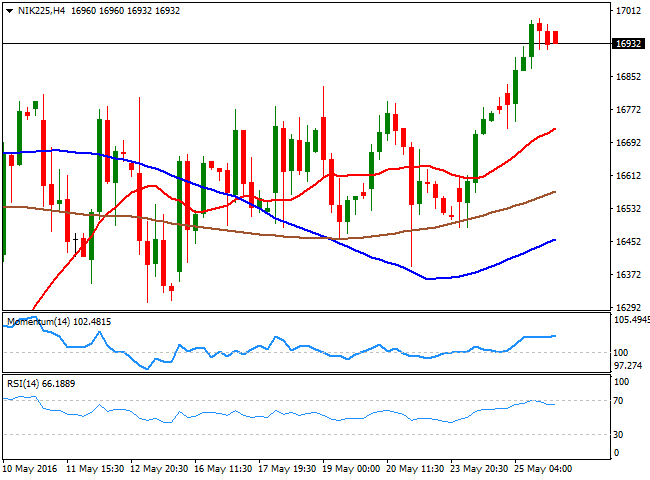
Gold
Gold prices kept falling this Wednesday, with spot down to $1,217.76 a troy ounce, its lowest since early April, weighed by solid prospects of a US June rate hike which maintained the dollar buoyed during the Asian and European sessions. The commodity trimmed half of its daily losses in the US afternoon, as demand for the dollar eased. Nevertheless, the commodity is closing its sixth consecutive day in the red, and while an upward corrective movement can' be ruled out, sentiment keeps favoring the downside, which means the market may see advances as opportunities to sell. Technically, the daily chart shows that the price extended below the 100 DMA, now near the daily ascendant trend line broken on Tuesday around 1.237.00, whilst the technical indicators have stalled their declines near oversold readings, but are still far from suggesting an upcoming upward move. In the 4 hours chart, the 20 SMA has extended sharply lower above the current level, whilst the technical indicators have partially corrected extreme oversold readings before turning back lower, favoring a new leg south for this Thursday. Support levels: 1,217.75 1,210.00 1,201.90 Resistance levels: 1,231.30 1,239.10 1,245.20
WTI Crude Oil
Crude oil prices surged to their highest in seven months, fueled late Tuesday by the American Petroleum Institute stockpiles data for last week, showing a 5.1-million-barrel decrease in crude supplies. The commodity was also fueled by the Energy Information Administration weekly release, showing that US crude stockpiles fell by 4.2 million barrels in the same week. WTI futures flirted with $50.00 a barrel, and settled a few cents below the critical level. Oil has recovered its upward momentum, and seems poised to extend its advance, given that in the daily chart, the price has accelerated further above a strongly bullish 20 SMA, while the technical indicators maintain strong upward slopes near overbought levels. In the 4 hours chart, the price develops well above its moving averages, also maintaining the risk towards the upside, although the technical indicators have lost upward strength, and turned flat within bullish territory, suggesting some consolidation ahead before a new leg north. Support levels: 49.20 48.60.48.10 Resistance levels: 49.90 50.50 51.15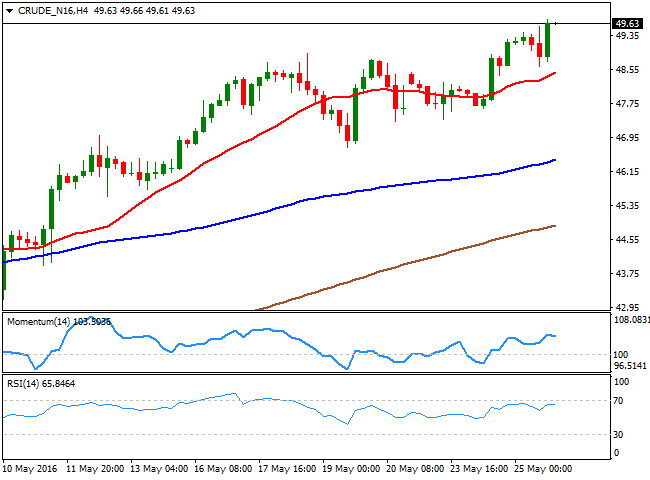
CFDs are complex instruments and come with a high risk of losing money rapidly due to leverage. 75% of retail investor accounts lose money when trading CFDs with this provider. You should consider whether you understand how CFDs work and whether you can afford to take the high risk of losing your money.
CFDs are complex instruments and come with a high risk of losing money rapidly due to leverage. 76.3% of retail investor accounts lose money when trading CFDs with this provider. You should consider whether you understand how CFDs work and whether you can afford to take the high risk of losing your money.


