
- Markets
Find out what influences market movements by browsing through our tailor made product pages.
- Trading Platforms
Maximise your investment opportunities

Trading Platforms
In order to ensure our customers have the best trading experience. We are proud to introduce our suite of trading platforms.
- Accounts
All accounts can be opened using one application form.

OPEN A LIVE ACCOUNT
The application process is simple and straightforward. You can complete the online application form and be trading in minutes.
- Academy
Here you will find all the details regarding One Financial Markets educational offering

TRADING ACADEMY
Working through each of our six online modules, detailed below, you can develop your trading confidence
- Newsroom
The latest news in the Financial Markets from across the globe.

LATEST NEWS
Make sure you don't miss out on what's going on in the world around you, keep up to date with our market commentary and daily market update videos.
- Contact Us

The week started in slow motion, with the EUR/USD falling to 1.0591
14th February 2017
EUR/USD
The week started in slow motion, with the EUR/USD falling to a 1.0591, its lowest in over three weeks, to finally settle a couple of pips above the 1.0600 level. There were no major releases in Europe and America, although the European Commission winter forecast showed that all EU member states' economies are expected to growth this year and the next, with 2017 growth for the region revised from 1.5% to 1.6%. The press release recons that the "risks surrounding these projections are exceptionally large," referring to the political woes the region faces all through this year.
Plenty of first-tier data will be released during the upcoming days, with German inflation, EU preliminary Q4 GDP, UK inflation and US PPI among the most relevant scheduled for this Tuesday. Still, sentiment will likely weigh more, and as long as the "Trump-trade" remains alive within stocks' traders, the dollar will result benefited across the FX board.
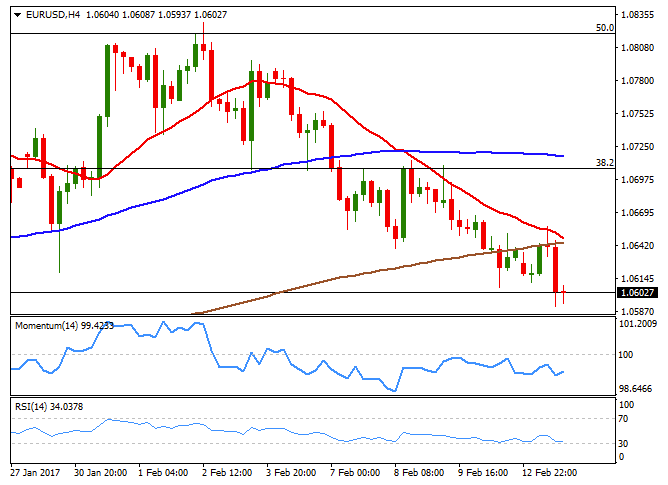
The EUR/USD pair presents a clear bearish stance having took one step further in its way to breaking below the critical 1.0565 support, the 23.6% retracement of the November/January decline. In the 4 hours chart, a bearish 20 SMA keeps containing the downside, now converging with the 200 SMA at 1.0650, whilst technical indicators hold within bearish territory, although with no certain directional strength, amid limited volumes. Advances up to the 1.0700/20 region will be likely be seen as selling opportunities, although a break beyond this last could see the recovery extending up to 1.0800/40, should upcoming US data disappoint big.
Support levels: 1.0590 1.0565 1.0520
Resistance levels: 1.0650 1.0690 1.0720
USD/JPY
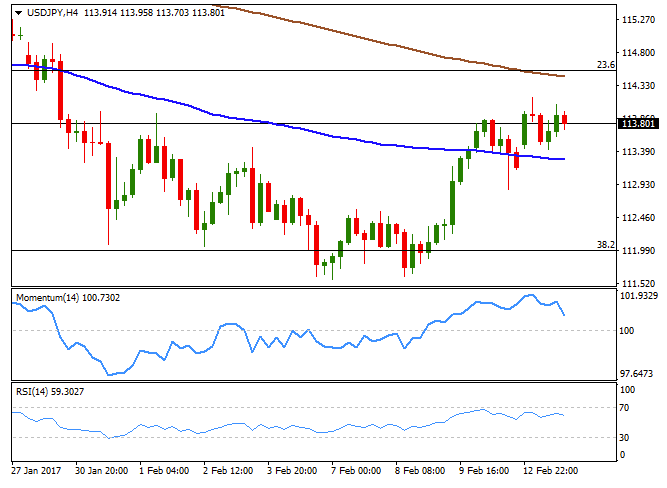
The USD/JPY pair added modest 40 pips at the beginning of the week, surprisingly limited, despite rising US yields and equities. Early Monday, Japan released its Q4 GDP figures, showing that the economy expanded by 0.2% in the three months to December, and by 1% annually. The figures were slightly below market's expectations of 0.3% and 1.1% respectively, although Japan’s finance minister, Nobuteru Ishihara, said that the soft growth didn't affect the government’s view that the economy remains in a moderate recovery. During the upcoming Asians session, the country will release its December industrial production figures, with better-than-expected readings fueling confidence among local investors and resulting in the JPY easing further. From a technical point of view, the upward potential remains limited, given that the pair is below the critical 114.50/60 region, the 23.6% retracement of the latest bullish run, and where a bearish 200 SMA stands in the 4 hours chart. In the same time frame, the Momentum indicator has turned sharply lower, but remains within positive territory, while the RSI has also turned modestly lower around 60. The daily low was set at 113.43, the immediate support and the level to break to see the pair easing further below the 113.00 mark.
Support levels: 113.40 113.00 112.60
Resistance levels: 114.00 114.55 114.90
GBP/USD
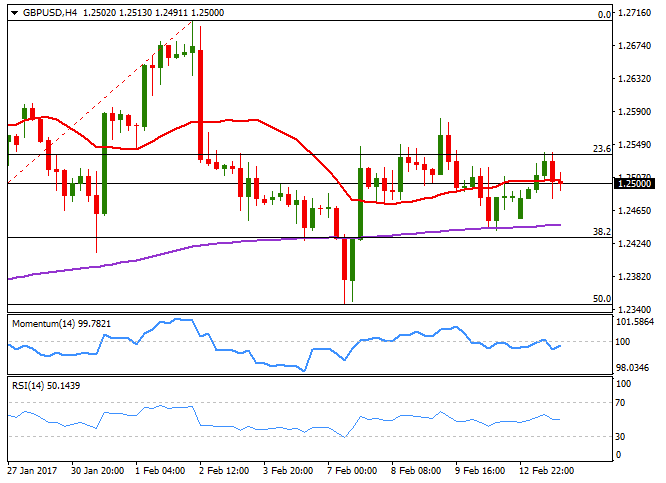
The Sterling outperformed its major rivals, closing the day marginally higher against the greenback above the 1.2500 level and not far from a daily high of 1.2538. There were no news coming from the UK this Monday, although the macroeconomic calendar will be quite busy during the upcoming days, as the kingdom set to publish its wholesale and retail inflation figures for January this Tuesday, generally expected above December final readings, and employment numbers next Wednesday. Focus will be on inflation, as a faster-than-expected pace of price growth, may force the BOE to revert its latest decision to cut rates to record lows, pushing the Pound higher as speculative interest rushes to price in the possible Central Bank's move. From a technical point of view, the pair met selling interest around the 23.6% retracement of the January/February rally this at 1.2535, the level to surpass to consider a more constructive outlook. In the 4 hours chart, the price is stuck around a horizontal 20 SMA, whilst technical indicators head nowhere around their mid-lines, reflecting the current investors' wait-and-see stance. Short term buying interest is aligned between 1.2470 and 1.2480, with a break below it probably resulting on a test of 1.2430, the next Fibonacci support.
Support levels: 1.2470 1.2430 1.2390
Resistance levels: 1.2535 1.2585 1.2620
AUD/USD
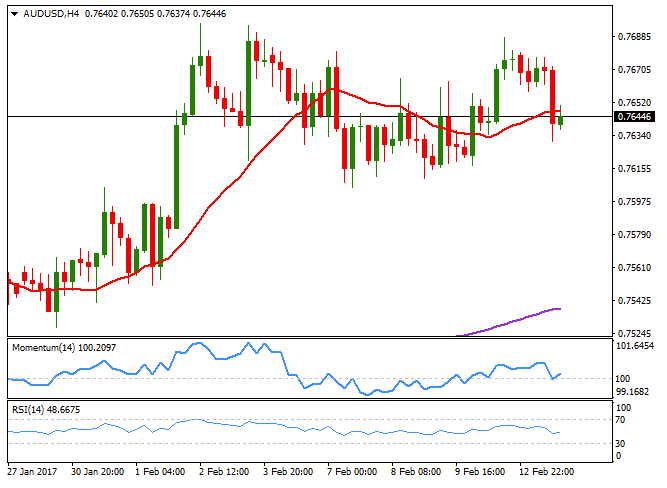
The AUD/USD pair advanced up to 0.7688 at the beginning of the day, but was once again rejected from the critical technical resistance. The pair fell down to 0.7630 on broad dollar's demand, but bounced back from the level as base metals gained, led by an advance in copper prices as the strike in the Escondida mine, in Chile, fueled concerns about supply shortages. Australia will release its NAB's Business Confidence index during the upcoming session, but the pair will likely react more to Chinese January inflation data, also to be released during the next few hours. Technically, the pair has made no progress, still confined within the 0.76/0.77 range, unable to find a clear direction. In the 4 hours chart, the price is hovering around a flat 20 SMA, whilst technical indicators have bounced modestly from their mid-lines, with not enough strength to confirm additional gains ahead. Spikes beyond the resistance have been steadily rejected since last April, and with the ongoing dollar's strength, a rally beyond 0.7700 may attract enough selling interest to send the pair down to the base of the mentioned range.
Support levels: 0.7605 0.7570 0.7530
Resistance levels: 0.7710 0.7745 0.7790
Dow Jones
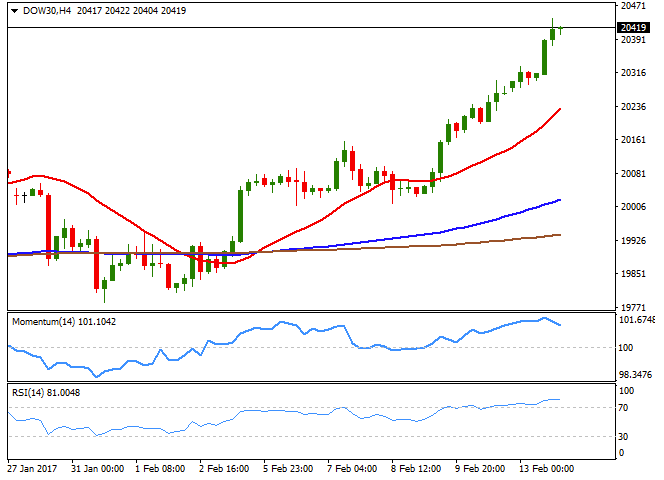
Wall Street extended its advance, posting record closes for a third consecutive day amid returning confidence on the US new administration. The "Trump-trade" resumed last week after the US president announced a major upcoming tax reform, expected to be business-friendly. The Dow Jones Industrial Average added 142 points and closed at 20,412.16, while the Nasdaq Composite settled at 5,763.96, up by 0.52%. The S&P gained 12 points or 0.52%, to 2,328.25. Financials led the way higher, with Goldman Sachs up 1.46% and JPMorgan Chase ending the day up by 1.32%. The DJIA traded as high as 20,441 and in the daily chart, the price is far above a now bullish 20 DMA, while technical indicators present strong bullish slopes, and particularly the RSI heads north around 76, with no signs of changing bias any time soon. In the 4 hours chart, the index is far above a strongly bullish 20 SMA, whilst technical indicators are giving signs of upward exhaustion, but remain within extreme overbought levels.
Support levels: 20,378 20,330 20,272
Resistance levels: 20,445 20,490 20,550
FTSE 100
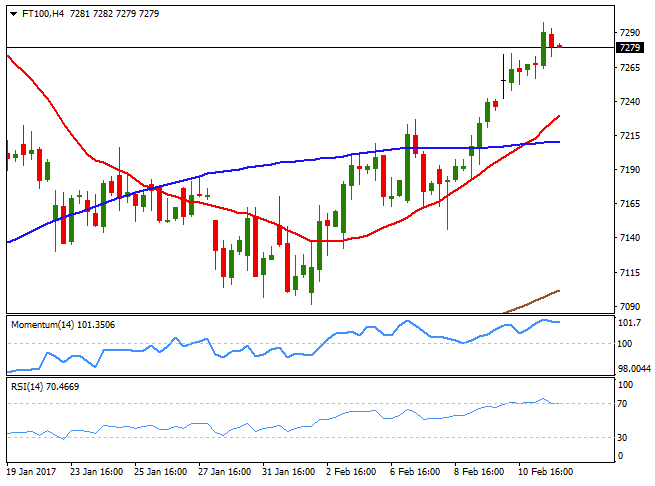
The FTSE 100 closed the day at 7,278.92, up by 20 points or 0.28%, underpinned by an advance in mining-related equities. Despite Pound's strength, a strike in Chile's largest copper mine kept the benchmark afloat. Anglo American gained 4.21%, Rio Tint 3.0% while Glencore added 2.56%, all topping gainers´ list. Capita, on the other hand, was the worst performer, down by 2.38%, followed by Fresnillo that lost 1.99%. In the daily chart, the upward momentum is fading in technical indicators, although they remain within positive territory, whilst the index stands above a bearish 20 DMA, currently at 7,190. In the shorter term and according to the 4 hours chart, the risk is towards the upside, as technical indicators have turned flat near overbought readings, but the benchmark stands above a bullish 20 SMA and not far from the record high posted last January at 7,354.
Support levels: 7,208 7,163 7,128
Resistance levels: 7,275 7,326 7,354
DAX
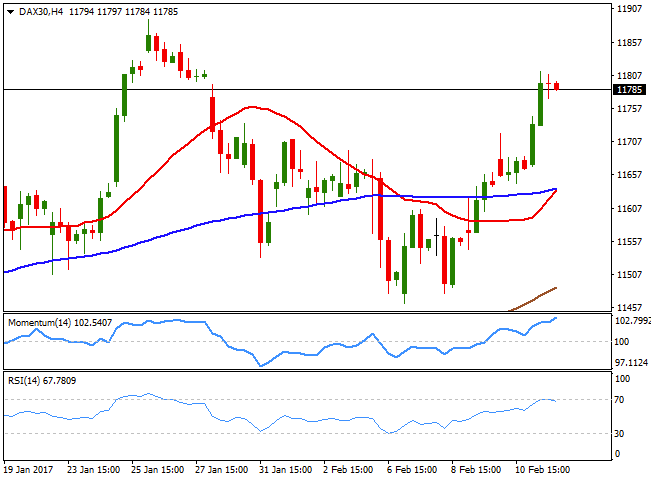
The German DAX advanced 108 points or 0.92% to close at its highest in over two weeks, as European equities benefited from a rally in basic resources´ stocks that began in Asia. Volkswagen was the best performer, up by 2.42%, while Deutsche Bank also made it to the top ten list, closing up 1.65%. Commerzbank was unable to follow suit, ending the day 0.34% lower. The index is biased higher according to technical readings in the daily chart, as it stands above a horizontal 20 DMA, whilst the Momentum indicator aims modestly higher around its 100 level, and the RSI indicator heads north around 62. In the shorter term, and according to the 4 hours chart, the 20 SMA has turned higher, now converging with the 100 SMA around 11,640, the Momentum indicator advances near overbought readings, whilst the RSI indicator consolidates within overbought readings, also maintaining the risk towards the upside.
Support levels: 11,745 11,694 11,640
Resistance levels: 11,815 11,854 11,891
Nikkei
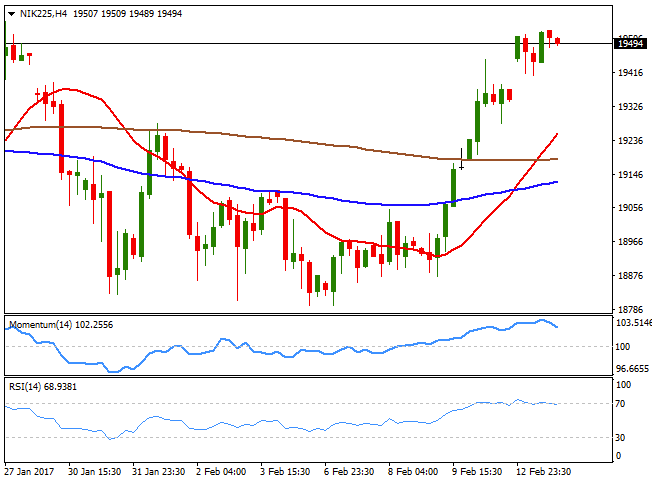
The Nikkei 225 closed the day at 19,459.15, up by 0.41% or 80 points, a fresh 2-week high, tracking Wall Street Friday's gains, and after the weekend meeting between US President Donald Trump and Japan’s Prime Minister Shinzo Abe ended without a new international conflict. The Japanese yen edged lower on weak growth figures, further supporting the rally in local stocks. Most members closed with gains, with Mitsubishi Materials being the best performer, up by 5.70%, followed by Toshiba that gained 5.09%. The index stands near 19,500 ahead of the opening, as US stocks extended their rally to record highs, and the daily chart shows that it stands near recent highs, but also that technical indicators present a limited upward potential, as the 20 SMA remains horizontal whilst the Momentum indicator holds flat around its 100 level. The RSI stands at 59, but lost upward strength, limiting chances of a strong advance for this Tuesday. In the shorter term, however, the upside seems more constructive, as in the 4 hours chart, the 20 SMA maintains a strong upward slope below the current level and after breaking above the 100 and 200 SMAs, whilst technical indicators are barely retreating from overbought readings.
Support levels: 19,450 19,385 19,310
Resistance levels: 19,529 19,575 19,637
Gold
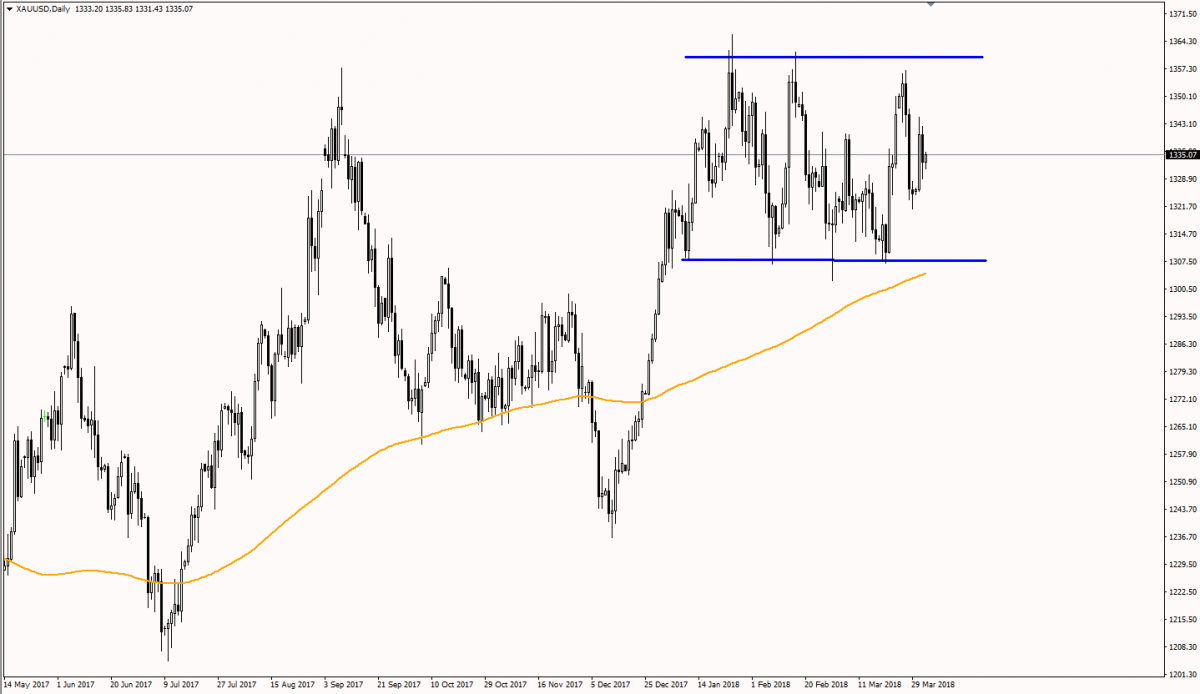
Spot gold fell to $1,219.26 a troy ounce this Monday, as risk appetite dominate the scene. The bright metal, however, bounced from the level to close the day around 1,226.50, on physical demand at the bullion market, as Indian jewelers bought to meet the wedding season demand. Also, limiting the slide were higher base-metal prices, on fears of copper shortages amid a strike in one of Chile's largest mine. The daily chart for gold indicates that the upward potential eased, but it's too early to call for a retracement, given that the price remains well above a bullish 20 DMA that remains above the 100 DMA, whilst technical indicators retreat, but remain within positive territory. In the 4 hours chart, the price is below a bearish 20 SMA that holds a few cents above the 50% retracement of the post-US election decline, this last around 1,230.00, while technical indicators have recovered within negative territory, holding below previous daily highs. Renewed selling interest below the mentioned daily low will likely see the commodity approaching the critical 1,200 region this Tuesday, where the latest bullish movement will be at risk of reversing.
Support levels: 1,219.20 1,210.10 1,200.00
Resistance levels: 1,230.00 1,237.10 1,244.70
WTI Crude Oil
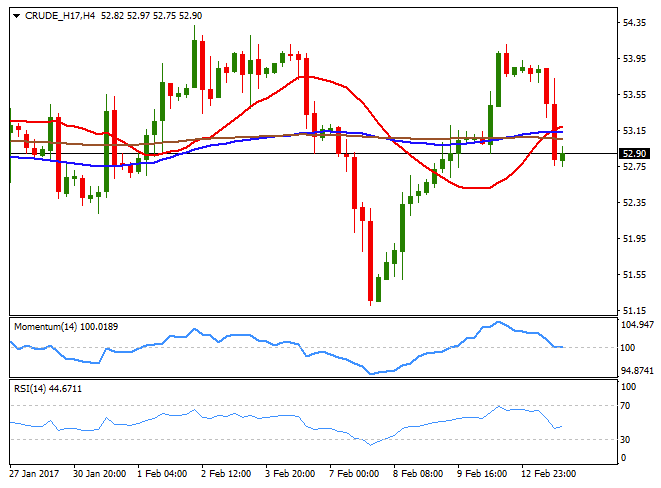
Crude oil prices edged lower this Monday, with West Texas Intermediate futures ending the day around $52.90 a barrel, down 1.7%. A stronger dollar added to EIA news, indicating that US shale oil production is expected to rise in March by 80,000 barrels per day to 4.87 million barrels per day, in the bearish case for the commodity. Rising US production offset news that the OPEC cut is output by 890,000 barrels per day in January a 93% compliance. The commodity retreated once again from the upper end of its latest range, still lacking direction according to technical readings, as in the daily chart, the price continues hovering around a horizontal 20 DMA, whilst technical indicators head nowhere within neutral territory. In the 4 hours chart, technical indicators have continued retreating from overbought readings, and turned lat after reaching their mid-lines, whilst the price broke below a congestion of flat moving averages that failed to signal a clear upcoming move.
Support levels: 52.60 52.00 51.40
Resistance levels: 53.30 54.10 54.70
CFDs are complex instruments and come with a high risk of losing money rapidly due to leverage. 75% of retail investor accounts lose money when trading CFDs with this provider. You should consider whether you understand how CFDs work and whether you can afford to take the high risk of losing your money.
CFDs are complex instruments and come with a high risk of losing money rapidly due to leverage. 76.3% of retail investor accounts lose money when trading CFDs with this provider. You should consider whether you understand how CFDs work and whether you can afford to take the high risk of losing your money.


