
FOUR WAYS TO USE AN RSI IN FOREX TRADING
6th August 2019
The RSI, or relative strength indicator, is one of the most popular technical indicators around. Although it’s one of the oldest indicators, it’s still as relevant as ever. It also happens to be a very versatile indicator and can be used as part of a wide range of trading strategies.
This post describes four ways you can use it when trading and answers some common questions regarding the RSI, including:
• What is the RSI in Forex?
• How do you calculate the RSI?
• What is the best RSI trading strategy?
The RSI is an oscillator which means it oscillates between fixed values – in this case, 0 and 100. It can be used effectively on any time frame from 1 minute to weekly. It’s also used to trade all markets, including forex, equities, and commodities.
Calculating the RSI
Any trading platform or technical analysis website you use is likely to include the RSI, so you probably won’t ever need to calculate it. However, knowing how it is calculated can help you understand exactly what the indicator measures.
The standard parameter or lookback period for an RSI is 14, though any number from 2 to 50 could be used. Commonly used parameters are 2, 5, 8, 14, and 21.
The RSI at any point in time compares the average positive movements to the average negative movements during the lookback period. To calculate it, you first separate the positive and negative movements and then average each.
Let’s say you are calculating the RSI for the following 5 price movements: 5, -2, -4, 3, 6
The positive average is (5+3+6)/3 = 4.67
The negative average is (2+4)/2 = 3
That gives a ratio of 4.67/3 or 1.56 which we call the RS. However, this number needs to be “normalised” to fall between 0 and 100.
To do this, we calculate 100 - (100/(1+RS)), which in this case is:
100 – (100/1+1.56) = 60.87
This is the RSI level at that point in time.
Using the RSI to identify overbought and oversold levels
The most common way to use an RSI is as an indication of overbought or oversold levels. This can be applied within trends or when the market is flat and trading within a range.
When using the standard parameter of 14, 30 is generally considered oversold and 70 is considered overbought. This can, however, differ depending on the instrument and time frame you are trading. You can look at how the indicator has behaved in the past for the chart you are using to determine the levels you will use.
An RSI should never be used in isolation. You need to use another method such as a trend line, moving averages, or Bollinger Bands to determine the trend and decide when it has changed. Just because the price is oversold, it does not mean the price will recover.
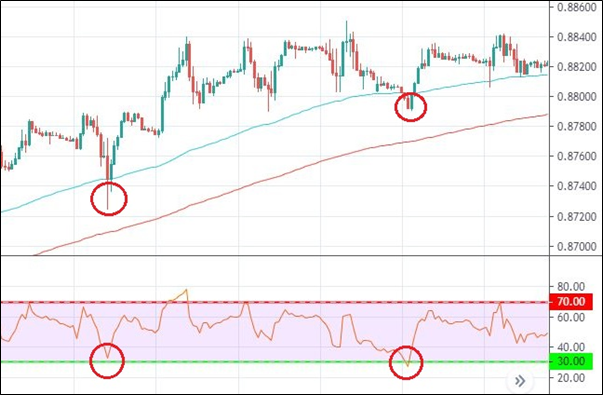
The following example includes a 14-period RSI and two exponential moving averages with periods of 100 and 200. The moving averages clearly indicate that the trend was up. On one occasion, the RSI almost reached 30, and on the second it did. Both occasions turned out to be great opportunities to open long positions. Note that in the first instance, the RSI would have been below 30 when the lowest candle was trading at its lowest — this still qualifies as the price was oversold before that candle closed.

RSI rejects the 50 level
Fifty represents the mid-point of an RSI’s range. This level can be used to confirm a change in trend and to confirm the direction of the trend when the price action is unclear.
The RSI can also give you a strong signal when it rejects the 50 level. This can happen either when the 50 level is briefly breached and then rejected, or when the RSI gets close to 50, and then reverses sharply. Either way, the sharper the reversal the more reliable the signal.
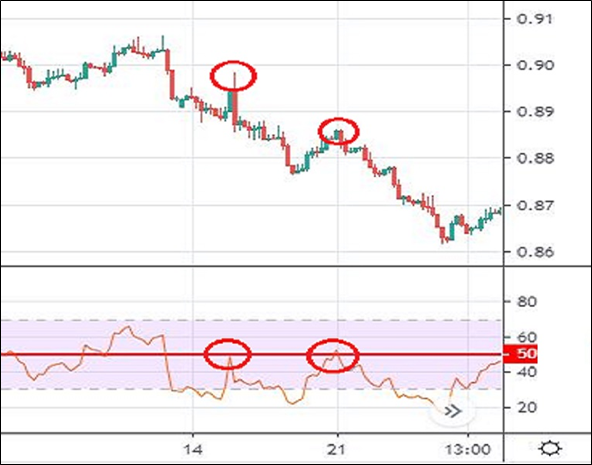
It’s important that a clear trend is underway, and that the signal is in the direction of that trend. The following chart shows a clear downtrend in place after a horizontal support level was broken. Two good signals to sell short were given. In the first instance, the RSI came close to 50 before reversing lower. In the second it briefly crossed the 50 level, and then reversed lower.

RSI divergence
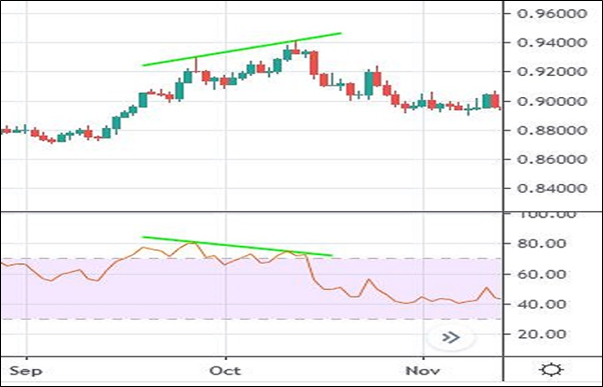
Like many other indicators, divergence between the price and the RSI can indicate potential retracements or changes in trend. If the price is making new highs, but the RSI isn’t, the price may soon correct or reverse. If the price is making new lower lows while the RSI begins to make higher lows, the price may soon move higher.
As is always the case with divergence, the magnitude of such a move cannot be determined from the RSI. Other indicators and support and resistance levels should be used for that. The chart below shows the price making higher highs, while the RSI begins to make lower highs. This is followed by a substantial retracement in the price.

Trend lines on the RSI
Just as you can draw trend lines on a price chart, you can also draw trend lines on an RSI. These can be used in several ways. If you have trend lines on both the price chart and the RSI, you can wait for both trend lines to be broken before assuming the trend has changed.
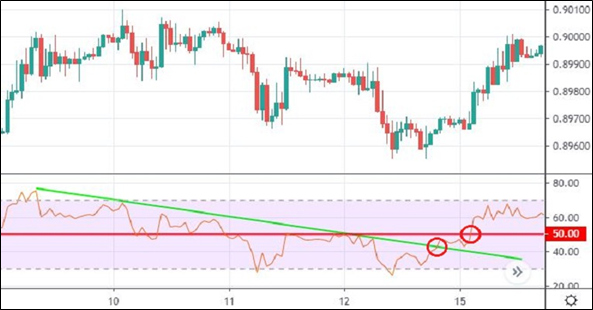
Sometimes the price action is such that it’s difficult to draw trend lines, which makes it difficult to determine when the trend has changed. The chart below is an example of such an instance. While trend lines could not be drawn on the price chart, a clear trend could be drawn on the RSI. The first circle shows where this was breached. It’s usually a good idea to look for confirmation, and this was provided when the RSI crossed 50, as indicated by the second circle.

To learn more about trading strategies, sign up for a FREE live trading seminar and webinar with One Financial Markets.
Begin trading today! Create an account by completing our form
Privacy Notice
At One Financial Markets we are committed to safeguarding your privacy.
Please see our Privacy Policy for details about what information is collected from you and why it is collected. We do not sell your information or use it other than as described in the Policy.
Please note that it is in our legitimate business interest to send you certain marketing emails from time to time. However, if you would prefer not to receive these you can opt-out by ticking the box below.
Alternatively, you can use the unsubscribe link at the bottom of the Demo account confirmation email or any subsequent emails we send.
By completing the form and downloading the platform you agree with the use of your personal information as detailed in the Policy.


