


- Markets
Find out what influences market movements by browsing through our tailor made product pages.
- Trading Platforms
Maximise your investment opportunities

Trading Platforms
In order to ensure our customers have the best trading experience. We are proud to introduce our suite of trading platforms.
- Accounts
All accounts can be opened using one application form.

OPEN A LIVE ACCOUNT
The application process is simple and straightforward. You can complete the online application form and be trading in minutes.
- Academy
Here you will find all the details regarding One Financial Markets educational offering

TRADING ACADEMY
Working through each of our six online modules, detailed below, you can develop your trading confidence
- Newsroom
The latest news in the Financial Markets from across the globe.

LATEST NEWS
Make sure you don't miss out on what's going on in the world around you, keep up to date with our market commentary and daily market update videos.
- Contact Us
ONE | Indicator
 At One Financial Markets we recognise that traders need regular and consistent price indicator information combined with a method to execute when these patterns occur, which is why we are proud to launch our bespoke ONE Indicator series to provide you with the necessary tools to analyse and execute.
What are Trading Indicators?
Trading Indicators are plugins which can be loaded on to a chart to help you identify high probability trade entry and exit points.
About the ONE | Indicator Series
We are offering new demo account & live account holders the opportunity to benefit from the ONE | Indicator series by pre-installing them on your ONE | MT4 trading platform.
It couldn't be easier, simply sign up for an account today.
This is your chance to get back into the market with the help of not 1 but 6 leading technical indicators.
If you are an existing client and would like to benefit from the ONE | Indicator series, please contact the dealing desk at dealers@ofmarkets.com
The directional indicator was created to give clients instant visual recognition to see live and historical battles between bulls and bears. We understand that at market peaks the bears gain ascendancy and take control while in the troughs the situation is reversed and the bulls gain ascendancy. The levels these peaks and troughs hit can be called support and resistance. These levels are where market participants are willing to sell as the market is overpriced or buy as they are undervalued at this specific time.
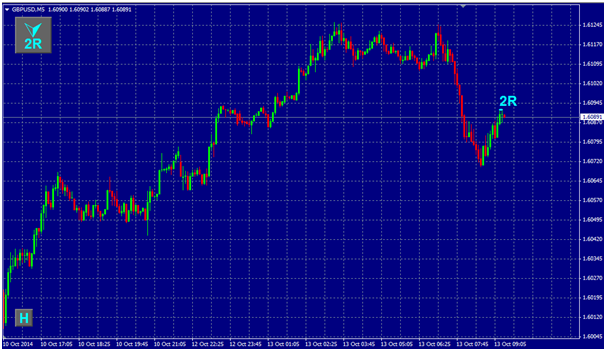
The indicator is based on highs and lows in different trading periods. So for example if GBPUSD makes a high of 1.6092 in the first 5 minute bar and if it makes the same high at the end of the next 5 minute bar you will get a 2R indicator prompt. This means that the price has bounced off this level in the past 2 trading periods. The opposite will happen if GBPUSD hits a low of 1.6092 and in the second period it ends with the low being 1.6092. A 2S indicator will appear showing the price had retraced from that level.
In the example below you can see a 2R pattern has been activated and this means that the high in the 2 periods has been identical. A bright visual information indicator is also triggered in the top left and when clicked on provides relevant trade information. (Chart 2)
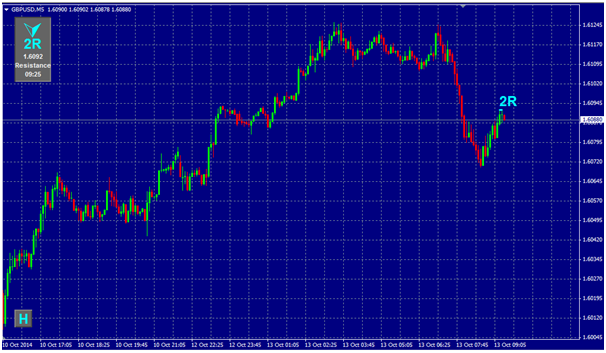
The live support and resistance indicators will increase in value as long as the price low or high is not broken, but we don’t stop there. We also provide the trader with historical pattern analysis which can provide traders with invaluable trade information.
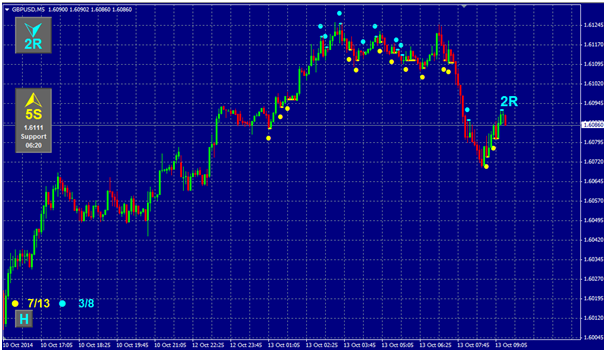
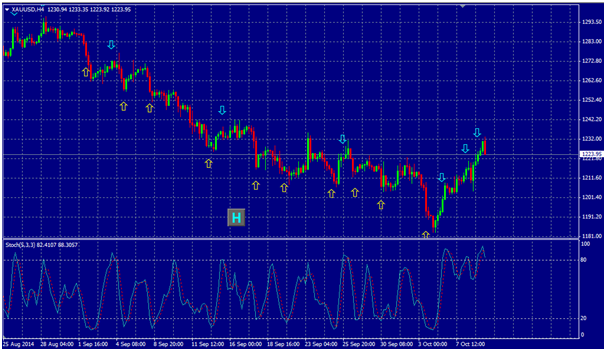
If the client clicks the H button in the bottom left he will be able to see when support and resistance levels have hit over a specific period.
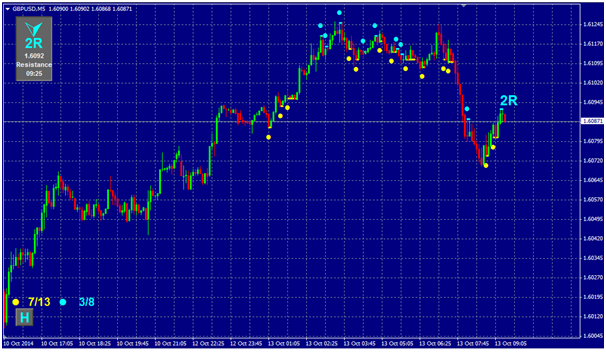
The dots identify when a support or resistance level was activated and if you click on the dot or bar an information tab will appear.
So Flash Trading provides instant support and resistance pattern recognition analysis which to any trader, whether they are making their first trade or their 1000th, is invaluable.
We also offer statistical data which provides trade probability outcome analysis. The numbers at the bottom of the chart show the number of support and resistance outcomes for that period and the outcomes where the period after the support or resistance is broken whether a new high or new low is created.
In our example above we have 13 instances when a support level has been hit and 7 out of those instances a new high is hit in the period preceding the initial support level. We also have 8 instances when the resistance level has been hit and 3 out of those instances a new low is made preceding the initial resistance level. The high and low analysis is to indicate to the trader that when a 2S or 2R indicator pops up, if you buy or sell at that time as illustrated in this example, there is a 53% chance of making money on support and 37% chance of making money on resistance. As long as a new high or a new low is made you have a chance of making money and that’s what trading is all about. Although historical outcomes cannot predict future outcomes it is this sort of analysis which can get the grey matter going and whether a client trades on it or not it is the mere fact that you know there are opportunities there that makes it invaluable.
The momentum indicator was created to provide visual recognition when momentum is starting to change in the market. The indicator uses the short term and long term moving averages and how their direction in the market is interpreted by investors
When in live trade, as soon as the moving averages start to cross a momentum indicator can be triggered. A GC will appear when the golden cross indicator is triggered. This happens if the short term moving average comes from below and crosses above the long term moving average; this is a buy signal. If you click on the GC symbol you get a price and time breakdown.
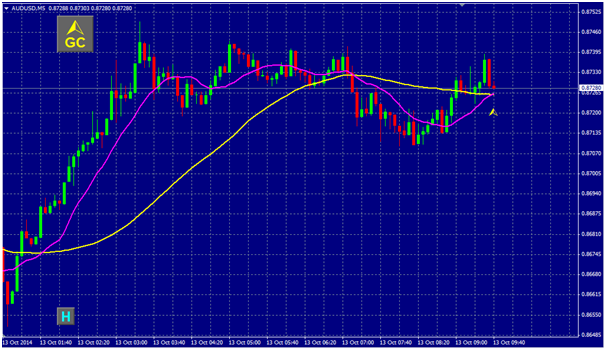
A DC symbol or death cross symbol will appear if the short term moving average comes from above and crosses below the long term moving average; this is a sell signal.
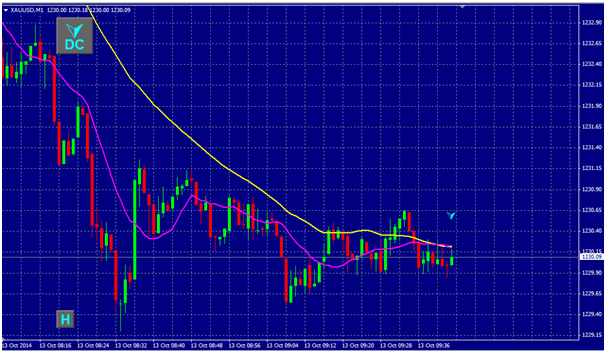
The indicator also has a H button in the bottom left of the chart which when clicked on can show all historical instances when the MA have crossed. This provides the client with the ability to research historical data of how the indicators work and helps make an informed trading decision.
If you click on the arrow it provides you with time and price data.
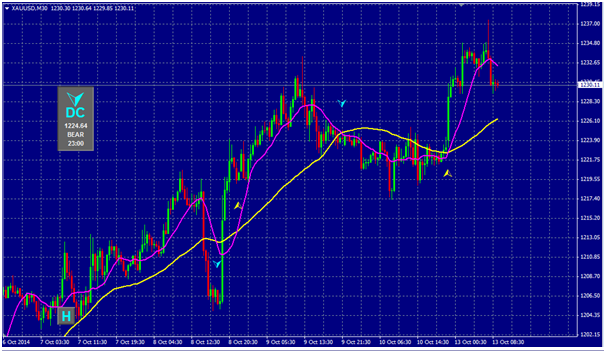
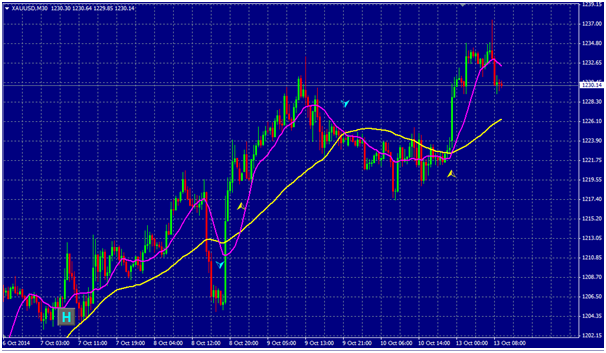
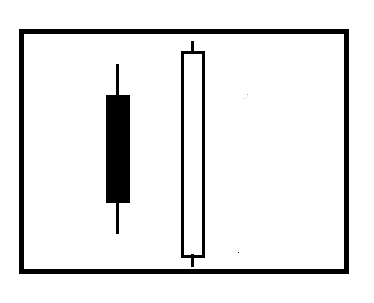
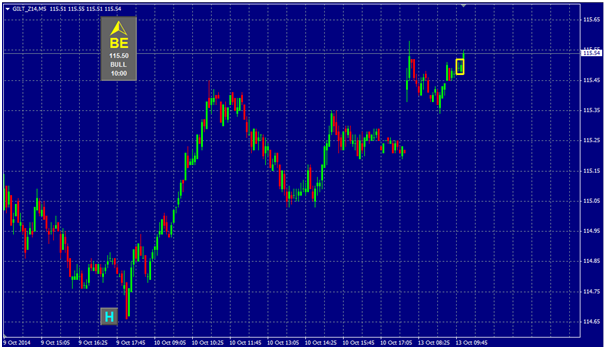
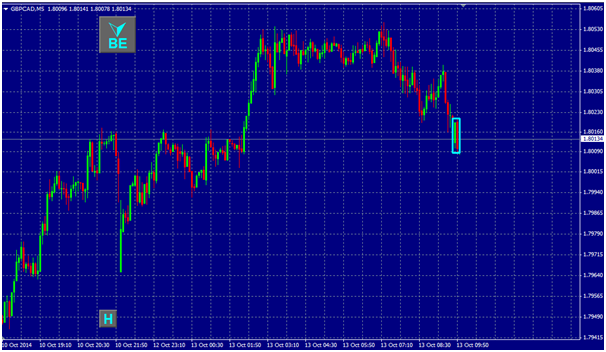
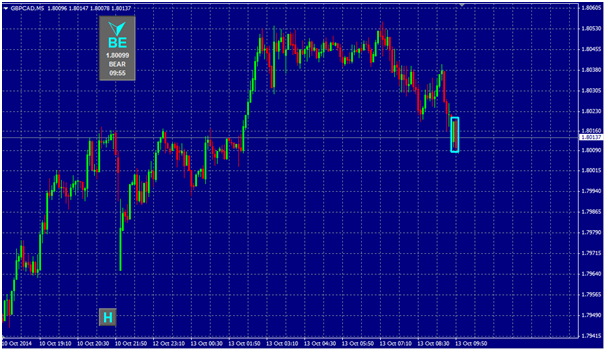
The engulfing indicator was created to help investors understand when sentiment is starting to change in the market .We look to identify two of the most compelling candlestick signals: bullish and bearish engulfing patterns.
Bullish pattern will be triggered when the first day of the bullish pattern is a down day before the bulls take over and reverse all the day’s loses. The wick, high and low of the signal day all need to be greater than the set up day. This would be indicated as a BE symbol like in the chart below.
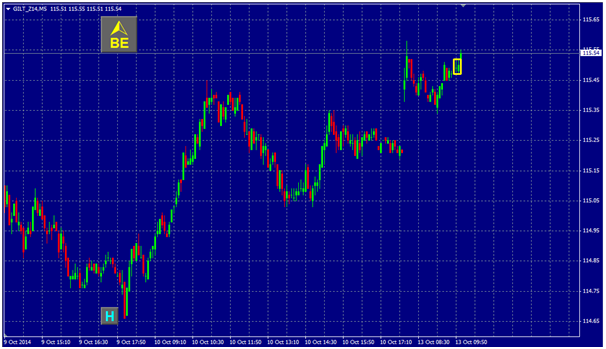
If you click on the BE symbol you get price, time and market direction data.
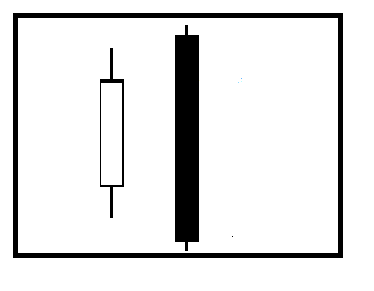
Bearish pattern will be triggered when the first day of the bearish pattern is a up day before the bears take over and reverse all the day’s gains. The wick, high and low of the signal day all need to be greater than the set up day.
If you click on the BE symbol you get price, time and market direction data.
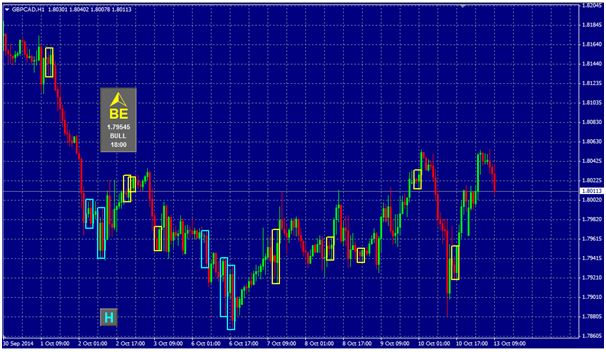
The indicator also has a H button in the bottom left of the chart which when clicked on can show all historical instances when the engulfing patterns have crossed. This provides the client with the ability to research historical data of how the indicators work and helps make an informed trading decision.
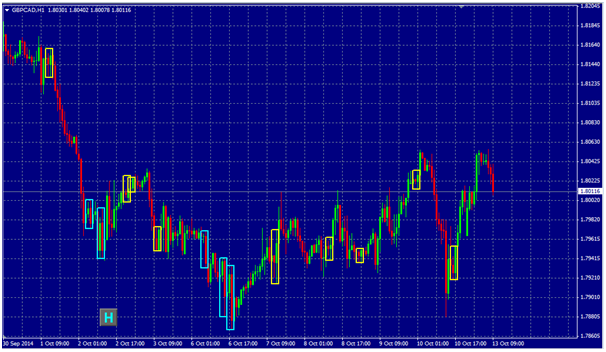
If you click on the arrow it provides you with time and price data.
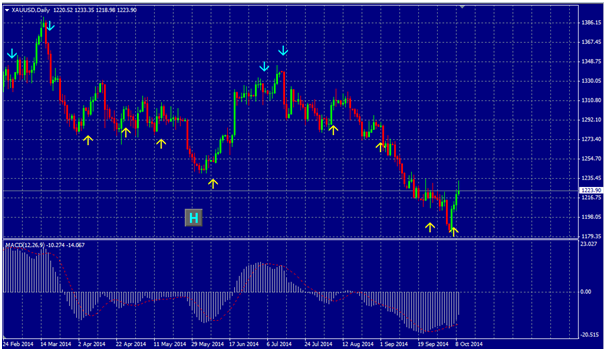
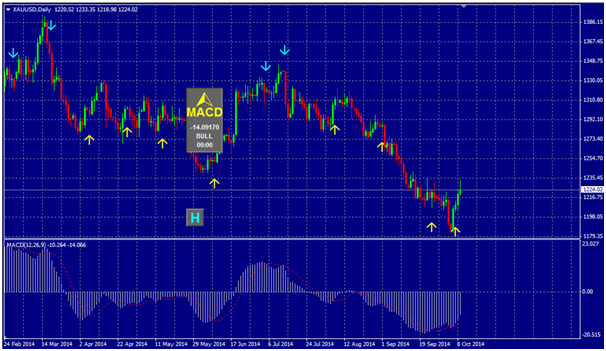
MOVING AVERAGE CONVERGENCE DIVERGENCE (MACD)
This is an indicator which should signal trend changes or indicate trend direction. The procedure uses two exponential moving average lines to indicate overbought and oversold signals that oscillate above and below a zero line.
SELL SIGNAL MACD
This is triggered when the FAST MACD line crosses from above to below the signal line and when both have positive values. It is illustrated with the MACD button and arrow being highlighted on the chart as and when it happens. The higher above the zero line this crossover occurs, the stronger the signal is said to be. Crossovers which occur with negative values should be ignored.
BUY SIGNAL MACD
This is indicated when the FAST MACD line crosses from below to above the signal line and when both have negative values. It is illustrated with the MACD button and arrow being highlighted on the chart as and when it happens. The further below the zero line this crossover occurs, the stronger the signal.
The MACD indicator will trigger and provide indication on your chart once the configured settings (which are set when the indicator is added) have been hit.

If you click on the MACD button it will display the time, the level and the market direction.
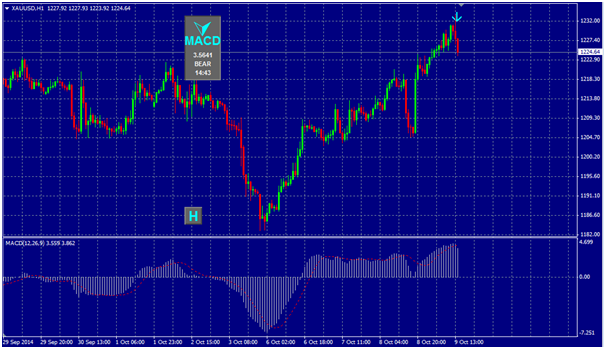
This indicator also has a historical data function where you can see all previous instances where the MACD levels have been triggered. In order to activate this, all you are required to do is click the H button and the chart shall be populated with all previous levels. This is a great function to assist with your daily, weekly, monthly and yearly analysis and is a great tool for all traders in the market.
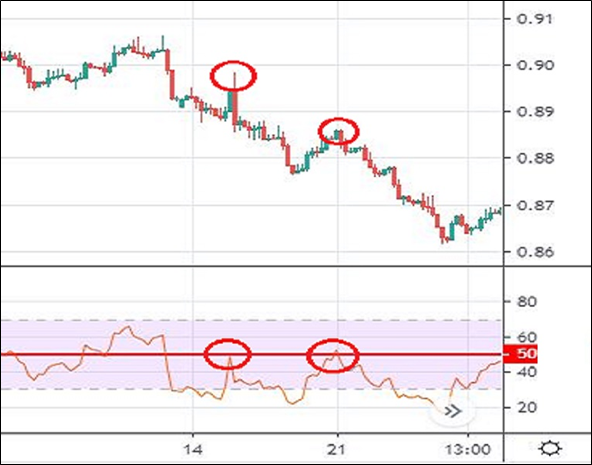
The RSI measures the ratio of up moves to down moves and normalises the calculation so that the index is expressed in a range of 0-100. If the RSI is 70 or greater then the instrument is seen as overbought – a situation whereby prices have risen more than market expectation. An RSI of 30 or less is seen as a signal that the instrument may be oversold – a situation whereby prices have fallen more than market expectations. Many analysts prefer to use overbought/oversold levels of 80/20 rather than 70/30. It is not a comparison with other instruments or the market in general – this is based purely on relative performance. The RSI indicator will trigger and provide indication on your chart once the configured settings (which are set when the indicator is added) have been hit.
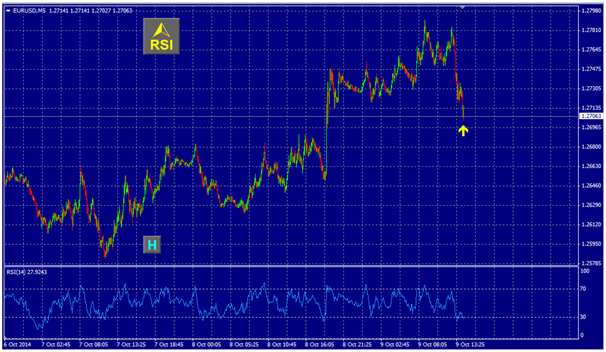
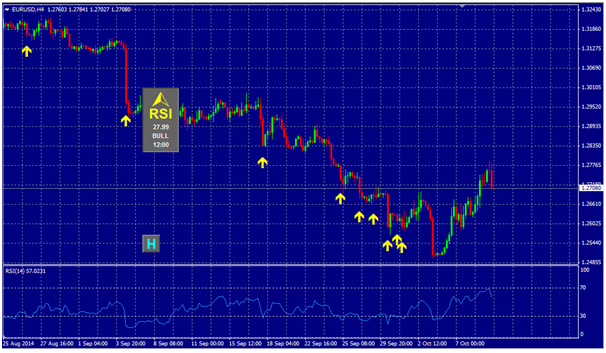
If you click on the RSI button it will display the time, the level and the market direction.
This indicator also has a historical data function where you can see all previous instances where the RSI levels have been triggered. In order to activate this, all you are required to do is click the H button and the chart shall be populated with all previous levels. This is a great function to assist with your daily, weekly, monthly and yearly analysis and is a great tool for all traders in the market.
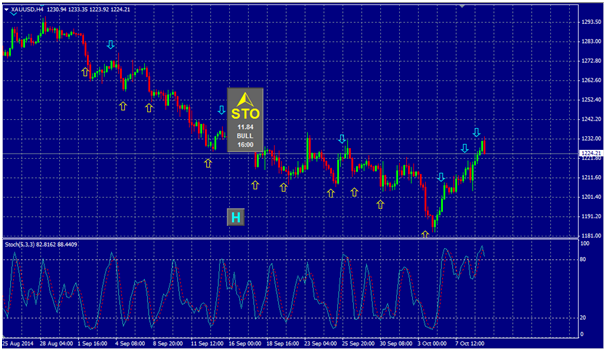
This is used to indicate overbought and oversold conditions on a scale of 0-100%. The indicator is based on the observation that in a strong up trend, closing prices for periods tend to concentrate in the higher part of the periods range. Conversely, as prices fall in a strong down trend, closing prices tend to be near to the extreme low period. Stochastics calculations produce two lines: %K and %D. These are used to indicate overbought and oversold areas on the chart. Divergence between the stochastic lines and price action of the underlying instrument gives a powerful trading signal. Overbought conditions are generally taken as occurring when the lines move over 70/80%. Oversold is taken when the lines move below 20/30%. The Stochastic indicator will trigger and provide indication on your chart once the configured settings (which are set when the indicator is added) have been hit.
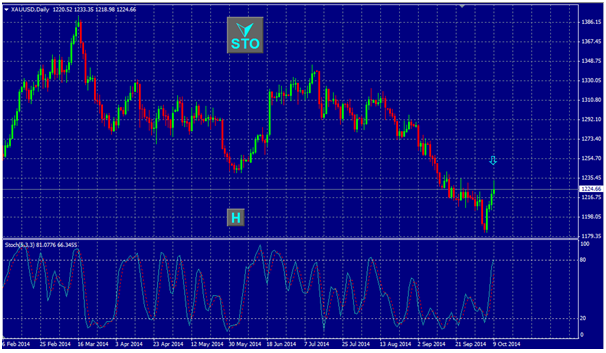
If you click on the Stochastic button it will display the time, the level and the market direction.
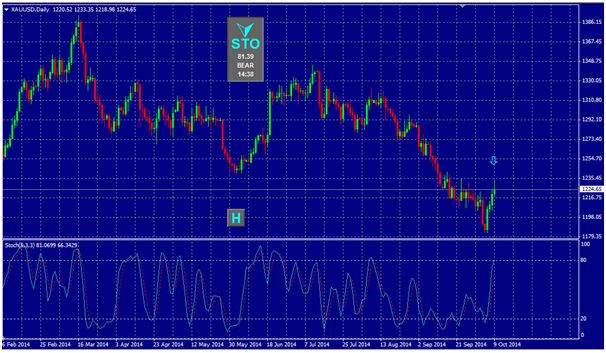
This indicator also has a historical data function where you can see all previous instances where the Stochastic levels have been triggered. In order to activate this all you are required to do is click the H button and the chart shall be populated with all previous levels. This is a great function to assist with your daily, weekly, monthly and yearly analysis and is a great tool for all traders in the market.
Open a demo/live account
today to take advantage of
the ONE | Indicator series
Privacy Notice
At One Financial Markets we are committed to safeguarding your privacy.
Please see our Privacy Policy for details about what information is collected from you and why it is collected. We do not sell your information or use it other than as described in the Policy.
Please note that it is in our legitimate business interest to send you certain marketing emails from time to time. However, if you would prefer not to receive these you can opt-out by ticking the box below.
Alternatively, you can use the unsubscribe link at the bottom of the Demo account confirmation email or any subsequent emails we send.
By completing the form and downloading the platform you agree with the use of your personal information as detailed in the Policy.