


- Markets
Find out what influences market movements by browsing through our tailor made product pages.
- Trading Platforms
Maximise your investment opportunities

Trading Platforms
In order to ensure our customers have the best trading experience. We are proud to introduce our suite of trading platforms.
- Accounts
All accounts can be opened using one application form.

OPEN A LIVE ACCOUNT
The application process is simple and straightforward. You can complete the online application form and be trading in minutes.
- Academy
Here you will find all the details regarding One Financial Markets educational offering

TRADING ACADEMY
Working through each of our six online modules, detailed below, you can develop your trading confidence
- Newsroom
The latest news in the Financial Markets from across the globe.

LATEST NEWS
Make sure you don't miss out on what's going on in the world around you, keep up to date with our market commentary and daily market update videos.
- Contact Us
HOW TO TRADE IN VOLATILE MARKETS
20th May 2019
There are times when the friendly confines of a smooth trending market become interrupted by unwanted volatility. While volatility might be difficult to trade, it provides opportunity and the ability for many traders to capitalize on whipsaw price action. There are several ways to determine when markets might become volatile. There are also several risk strategies for trading in volatile markets that you can employ to make sure you don’t lose your shirt. Whether you are a novice or expert trader, you should pay attention to signs of rising or falling volatility to capital in the financial markets.
What is volatility?
What you should always remember is that price action is a function of market participants’ emotions. Fear and greed are the backbones of short-term price movements, and fear is the general driver behind volatility. When traders believe there is a lot of money at stake or there is the possibility that they will lose money, price action will become volatile.
Volatility is defined as the square root of the standard deviations of prices. The standard deviations describe how much a price deviates from the mean. Historical volatility tells you how volatile the market has been, and by looking at a chart of volatility, you can see how volatile it has been in the past.
Each asset has a different reason to become more or less volatile. For example, when stocks increase in value, generally volatility declines. This is because most investors are long stocks and are not concerned when the price rises.
What happens to prices when volatility rises or falls?
When volatility rises, market participants are less willing to hold on to positions for an extended period. This is because they are aware that there could be quick changes to the value of an exchange rate or price that could turn a potential gain into a loss. When volatility falls, market participants become complacent and believe that a trend could remain in place for an extended period.
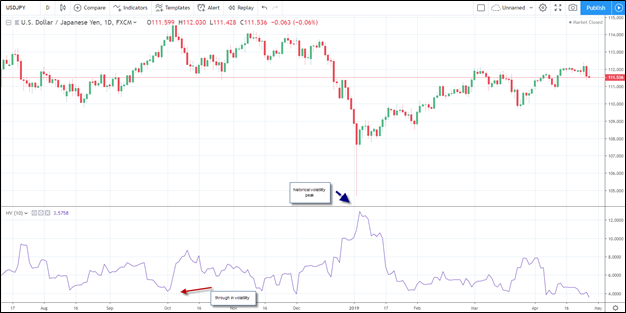
The chart of the USD/JPY also shows the historical volatility of the exchange rate. You can see in early 2019, historical volatility was rising after it troughed in early December of 2018. As the USD/JPY declined, historical volatility increased as traders accelerated their reduction of long USD/JPY positions. The flash crash in the USD/JPY coincided with the peak in historical volatility.
In October of 2018, historical volatility troughed which coincided with the peak in the USD/JPY exchange rate. A trend that had been in place for six weeks, pushed historical volatility to subdued levels which were a sign that market participants had become complacent.
How can you gauge volatility?
The key to understanding volatility is to acknowledge that it exists and that it cannot be completely avoided. Volatility generally rises ahead of key economic data, political events, or monetary policy decision. As the markets begin to prepare for new information, volatility will rise. The lack of new information can provide a trending market, where volatility declines.
Since its nearly impossible to completely avoid volatility, what is important is that you are cognizant that volatility could be on the horizon and have a plan on how to manage rising volatility.
The first step is to be on the lookout for rising volatility. You can use a chart of historical volatility, as well as analyse option premiums to determine if implied volatility is on the rise. Implied volatility is the estimate of the market of future volatility and is incorporated into option prices.
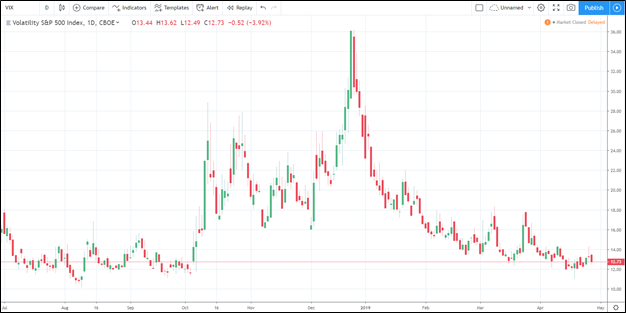
For example, the VIX volatility index measures the “at the money” strike prices for the S&P 500 Index. This index is a future gauge of volatility for the S&P 500 index. It generally falls when the S&P 500 is trending higherand rises as the S&P 500 begins to fall. In late December of 2018, options traders priced in that the S&P 500 could rise or fall 36% from those current levels. Today, options traders are only pricing in a 12% move.
By using a gauge like the VIX, you can determine if a subset of the market is worried about a potential decline and if prices are likely to trend or become volatile.
How can you manage risk when trading in volatile markets?
It’s very important that you have trading strategies in place when engaging in volatile trading. When volatility starts to rise, you want to make sure that you have a plan on how to manage your risk appropriately. This could mean that you have tighter stop loss levels. It could also mean that your take profit levels are reduced to incorporate more volatile price action.
You also want to make sure that the strategy you plan to use incorporates volatility. Trend following strategies generally experience hard times when exchange rates are chopping around in a tight range. This compares to a mean-reverting strategy which will generally outperform when markets become volatile.
You also might consider reducing your leverage or reducing your position size when the markets become volatile. Volatility runs hand in hand with higher levels of fear, which can generate outsized moves in a market. The last thing you want to happen is for your losses to get out of control just as the markets become volatile. By making sure that you have your risk parameters in place, you give yourself the best chance at containing losses when volatility begins to increase.
Conclusion
Volatility is part of all capital markets. It comes and goes along with emotions like fear and greed. While volatility might be difficult to trade, it provides opportunity and the ability for many traders to capitalize on whipsaw price action. There are several ways to determine when markets might become volatile, such as evaluating historical volatility or implied volatility. There are also several risk strategies that you can employ to make sure you don’t lose your shirt, such as reducing your leverage or your position size. Whether you are a novice or expert trader, you need to pay attention to the signs of rising or falling volatility to capitalize in the financial markets.
All content is provided for your information only.
This article may contain opinions and is not advice or a recommendation to buy, sell or hold any investment. No representation or warranty is given on the present or future value or price of any investment, and investors should form their own view on any proposed investment. This article has not been prepared in accordance with legal requirements designed to promote the independence of investment research and is considered a marketing communication. Non-independent research is not subject to FCA rules prohibiting dealing ahead of research, however we have put controls in place (including dealing restrictions, physical and information barriers) to manage potential conflicts of interest presented by such dealing.
One Financial Markets expressly disclaims all liability from actions or transactions arising out of the usage of this content. By using our services, you expressly agree to hold One Financial Markets harmless against any claims whatsoever and confirm that your actions are at your sole discretion and risk.
Begin trading today! Create an account by completing our form
Privacy Notice
At One Financial Markets we are committed to safeguarding your privacy.
Please see our Privacy Policy for details about what information is collected from you and why it is collected. We do not sell your information or use it other than as described in the Policy.
Please note that it is in our legitimate business interest to send you certain marketing emails from time to time. However, if you would prefer not to receive these you can opt-out by ticking the box below.
Alternatively, you can use the unsubscribe link at the bottom of the Demo account confirmation email or any subsequent emails we send.
By completing the form and downloading the platform you agree with the use of your personal information as detailed in the Policy.