
WHY YOU SHOULD KNOW HOW TO USE THESE SIX TRADING INDICATORS
12th September 2019
Trading the capital markets requires a strategy. You should have a good reason to enter a trade and a plan on why you want to exit that trade. The decision-making process should be predicated on several variables, including the current market environment.
To enhance your ability to make a good trade, you can use different indicators which will provide you with clues about the current market environment. Here are the six trading indicators you should know how to use to enhance your trading prowess.
1. Trend Following
Approximately 30% of the time, a security or exchange rate will trend. A trend is a pattern that perpetuates and moves in the same direction until the trend concludes. There is a saying: “The trend is your friend” which means that it is easier to make money when a security is trending compared to attempting to fight the trend and make money when a security is consolidating. There are several indicators you can use to determine if a security is trending. One of the best indicators is the moving average crossover.
A moving average is the average of a specific number of price points. For example, a 5-day moving average is created by using the average of the last five daily closes. On the sixth day, the first day is dropped from the average and this continues. You can use a daily closing price, the high of the day, the low of the day or even weekly or monthly closes to create an average.
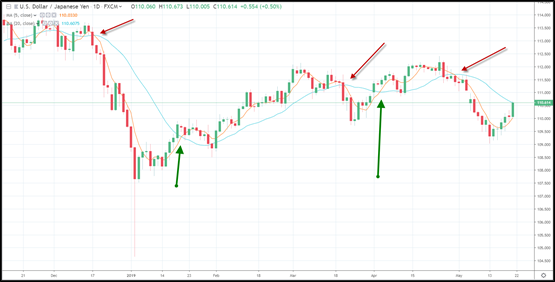
One of the most popular trend-following strategies is the moving average crossover strategy. This occurs when a short term moving average crosses above or below a longer-term moving average. In the chart below of the USD/JPY, the 5-day moving average and the 20-day moving average are plotted. When the 5-day moving average crosses above the 20-day moving average, a buy signal is generated (green arrows).
When the 5-day moving average crosses below the 20-day moving average, a sell signal is generated (red arrows). The moving average crossover tells you when a short-term trend is occurring. This indicator generally points to the middle of a short-term trend. If you want to capture a longer trend, you can use longer moving averages.

2. Momentum
There are several momentum indicators that you should know, but the most popular is the MACD. Created by Gerald Appel, the moving average convergence divergence (MACD) index not only generates buy and sell signals based on changes in momentum, but it also describes ongoing momentum.
Like trend following, momentum uses moving averages to describe momentum. Positive and negative momentum is accelerating as a short-term moving average diverges away from a longer-term moving average.
The MACD buy signal is created as the MACD line (the 12-day exponential moving average minus the 26-day exponential moving average) crosses above the MACD signal line which is defined as the 9-day exponential moving average of the MACD line. The MACD sell signal occurs when the MACD line crosses below the MACD signal line.

The MACD buy signals in the chart above the USD/JPY are designated by the green arrows and the MACD sell signals are labelled with red arrows.
In addition, there is a MACD histogram, which moves in tandem with the MACD line. As the trajectory of the MACD histogram rises, momentum is accelerating. As the MACD histogram is falling momentum is declining.
3. Overbought or Oversold (Part A)
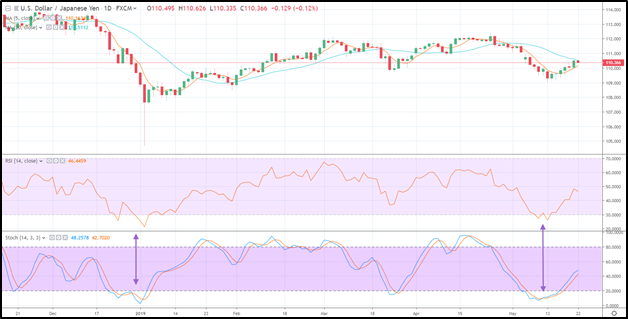
There are two very good indicators that you need to be aware of that describe overbought and oversold conditions. The first is the relative strength index (RSI). The RSI was created by J. Welles Wilder in the 1970s. The RSI is a momentum oscillator that generates an index between 1-100. The oscillator evaluates the change in the price of an asset over the past 14-day period. Index levels on the RSI above 70 are considered overbought. Reading on the RSI below 30 are considered oversold.
4. Overbought or Oversold (Part B)
A second very good indicator that is often used to find overbought or oversold conditions is the fast stochastic. The stochastic is an oscillator that ranges from 1-100 and is similar to the RSI in that it measures the changes in price over a specific period. Measurements on the fast stochastic below 20 are considered oversold, while readings on the fast stochastic above 80 are considered overbought.

5. Mean Reversion
While the markets only trend approximately 30% of the time, the majority of the time securities trade in ranges. To take advantage of a range-bound currency or asset, you can use an indicator called Bollinger bands. The Bollinger bands were invented by John Bollinger. The goal is to capture a range that incorporates the majority of the trading over a specific period.
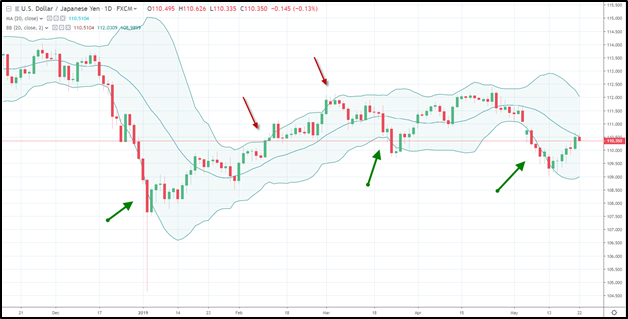
The default for Bollinger bands is the 20-day moving average and a 2-standard deviation range around the 20-day moving average. This range will show you 95% of the data points that traded around the 20-day moving average.

When the price of an exchange rate crosses below the Bollinger band low (2-standard deviations below the 20-day moving average) reflected by the green arrow, a buy signal is generated. When the price or exchange rate crosses above the Bollinger band high (2-standard deviations above the 20-day moving average) labelled as a red arrow, a sell signal is generated.
As you can see, when the USD/JPY is trading sideways the Bollinger bands do a very good job of encapsulating the range. When the exchange rate trends, a false signal can be generated. The Bollinger bands are a great tool to use in conjunction with another tool such as the RSI or the fast stochastic.
6. Sentiment
Sentiment describes the emotions of the market. Fear and greed help drive the daily swings that market participants create. One of the best ways to measure sentiment is to use an implied volatility index.
The VIX volatility index measures the implied volatility of the S&P 500 index. Implied volatility is market participants estimate of how much a security or exchange rate will move. Implied volatility is the key input used to price the premium of an option. When an index like the VIX is elevated, fear is perpetuating driving up the cost of protection. When the VIX is subdued, complacency sets in and implied volatility slips. You can use the VIX as a contrarian indicator. You can also measure the VIX using Bollinger bands, the RSI and fast stochastic to determine if it’s reached an extreme.

All content is provided for your information only.
This article may contain opinions and is not advice or a recommendation to buy, sell or hold any investment. No representation or warranty is given on the present or future value or price of any investment, and investors should form their own view on any proposed investment. This article has not been prepared in accordance with legal requirements designed to promote the independence of investment research and is considered a marketing communication. Non-independent research is not subject to FCA rules prohibiting dealing ahead of research, however we have put controls in place (including dealing restrictions, physical and information barriers) to manage potential conflicts of interest presented by such dealing.
One Financial Markets expressly disclaims all liability from actions or transactions arising out of the usage of this content. By using our services, you expressly agree to hold One Financial Markets harmless against any claims whatsoever and confirm that your actions are at your sole discretion and risk.
Begin trading today! Create an account by completing our form
Privacy Notice
At One Financial Markets we are committed to safeguarding your privacy.
Please see our Privacy Policy for details about what information is collected from you and why it is collected. We do not sell your information or use it other than as described in the Policy.
Please note that it is in our legitimate business interest to send you certain marketing emails from time to time. However, if you would prefer not to receive these you can opt-out by ticking the box below.
Alternatively, you can use the unsubscribe link at the bottom of the Demo account confirmation email or any subsequent emails we send.
By completing the form and downloading the platform you agree with the use of your personal information as detailed in the Policy.


